The Complete Guide to Search Engine Marketing Reports for B2B Teams and Agencies
Discover how to create impactful SEM reports by integrating key metrics and AI visibility data. Understand essential elements for decision-driven reporting.
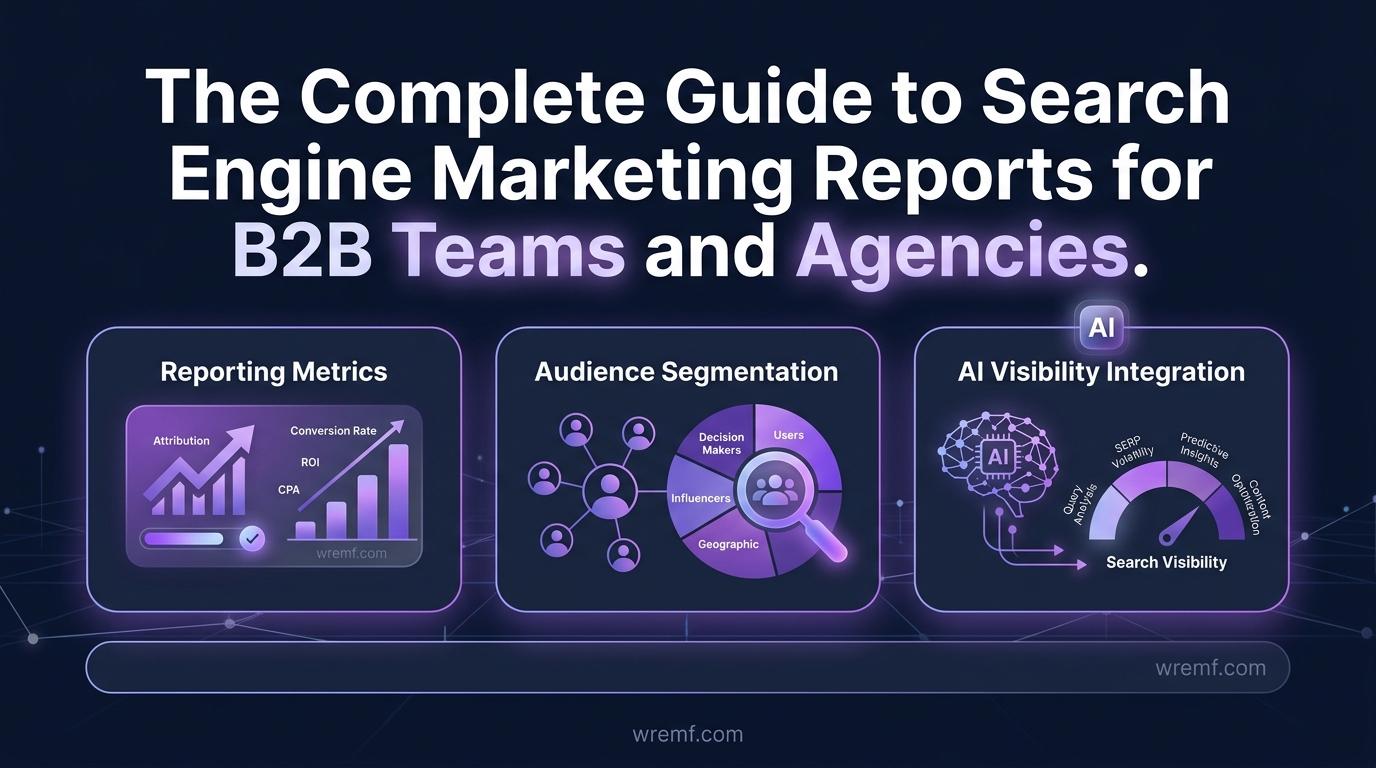
By WREMF Team · 2026-09-15
Search engine marketing reports are structured documents that track paid and organic search performance. They measure metrics like impressions, Click-Through Rate, Cost Per Click, conversion rate, ROAS, and keyword rankings, connecting them to business outcomes. Modern SEM reports include AI visibility data in addition to traditional Google Ads and Google Analytics data, reflecting changes in buyer journeys starting with AI engines. Effective SEM reporting drives decisions by integrating paid performance data, organic SEO reports, and AI visibility metrics into cohesive dashboards.
Key takeaways
- Connect SEM metrics to business outcomes for better decision-making.
- Include AI visibility data alongside traditional data for a full performance picture.
- Tailor reports to different audiences with appropriate detail levels.
- Use ten key performance indicators to maintain report focus.
- Utilize automation tools to improve reporting efficiency for agencies.
The Complete Guide to Search Engine Marketing Reports for B2B Teams and Agencies
Search engine marketing reports are structured documents that measure paid and organic search performance so teams can connect campaign activity to revenue, conversions, and business objectives. SEM reporting has become more complex as buyer journeys increasingly begin in AI engines, making it essential to track visibility beyond Google Ads and traditional keyword rankings. This guide is for B2B marketing teams, PPC teams, SEO managers, agencies, and growth leaders who need to build reports that actually drive decisions. It covers what to include in search engine marketing reports, which Key Performance Indicators matter most, how to build dashboards that work for different stakeholders, and how AI visibility data is changing what good SEM reporting looks like in 2026.
QUICK ANSWER:
Search engine marketing reports track paid and organic search performance across metrics such as impressions, clicks, Click-Through Rate, Cost Per Click, conversion rate, ROAS, and keyword rankings. A strong SEM report connects these metrics to business outcomes, segments data by campaign and audience, highlights trends over time, and recommends clear next actions. Modern reports increasingly include AI visibility data alongside traditional Google Ads and Google Analytics data.
KEY TAKEAWAYS:
- Search engine marketing reports should connect campaign metrics to revenue and business objectives, not just surface-level performance numbers.
- Key metrics to include are impressions, Click-Through Rate, Cost Per Click, conversion rate, Return on Ad Spend, Cost Per Acquisition, and impression share.
- Reports should be tailored to the audience, with executive summaries for stakeholders and granular breakdowns for PPC teams and campaign managers.
- AI visibility data, including Share of Voice in AI Answers and AI recommendations, is now a meaningful addition to modern SEM reporting frameworks.
- Tools such as Google Analytics 4, Google Search Console, Looker Studio, and WREMF can be integrated to build a complete view of search performance across paid, organic, and AI surfaces.
- Automation tools reduce manual report generation time and improve reporting cadence consistency for agencies managing multiple clients.
What Search Engine Marketing Reporting Actually Measures
Search engine marketing reporting measures how well paid and organic search campaigns deliver clicks, conversions, and revenue relative to cost. SEM reporting covers the full performance loop from ad impression to customer acquisition, giving teams the data needed to optimise spend and justify investment.
Search Engine Marketing is the practice of gaining visibility on search engine results pages through paid advertising, typically via Google Ads or Microsoft Advertising, and through search engine optimization that improves organic rankings. While SEM traditionally referred specifically to paid search, most reporting frameworks today combine paid and organic signals into one view because buyers move between both surfaces before converting.
A search engine marketing report is the structured output of that measurement process. It brings together data from platforms such as Google Ads, Google Analytics, Google Search Console, and Microsoft Advertising to answer three questions: what happened, why it happened, and what to do next. Reports built only to answer the first question produce data summaries. Reports built to answer all three produce decisions.
The distinction matters because marketing teams and stakeholders do not need more data. They need fewer metrics explained clearly, with each metric tied to a business outcome. A report showing 500,000 impressions means very little without context about conversion rate, Cost Per Click, and whether that visibility produced qualified leads or revenue.
Modern SEM reporting has a fourth question to consider: where is the brand visible outside of traditional search? As AI overviews and prompt-based answer engines like ChatGPT, Perplexity, and Gemini become part of how buyers research vendors, teams need AI visibility data alongside conventional campaign performance data. Understanding whether a brand is being cited or recommended in AI-generated answers requires a different measurement layer, one that traditional Google Analytics 4 reporting alone cannot provide.
Teams building comprehensive search engine marketing reports in 2026 are integrating paid performance data, organic SEO reports, and AI visibility metrics into unified dashboards. That integration is what separates reporting that informs strategy from reporting that simply records activity.
KEY TAKEAWAY: Search engine marketing reports only drive decisions when they connect campaign metrics to business outcomes and include both paid and organic performance data, with AI visibility data increasingly required for a complete picture.
SEM vs SEO vs PPC: Clarifying What Each Report Covers
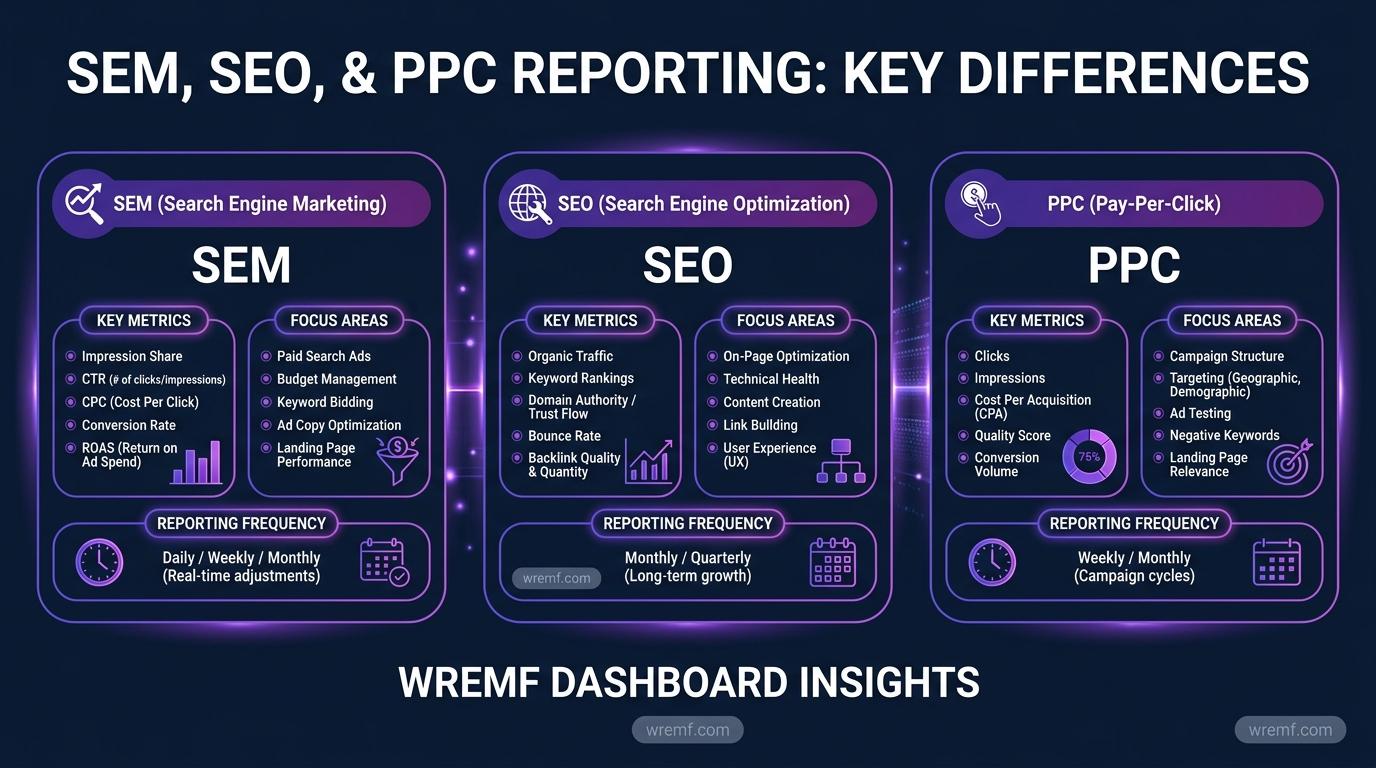
SEM reporting, SEO reporting, and PPC reporting overlap significantly but are not interchangeable, and confusing them leads to incomplete analysis. Understanding the scope of each helps teams build reports that answer the right questions.
Pay-per-click reporting focuses specifically on paid advertising performance. A PPC report covers Google Ads spend, impressions, clicks, Click-Through Rate, Cost Per Click, conversion tracking, quality score, ad position, and Return on Ad Spend. It is campaign-level and cost-centric. PPC teams use these reports to manage budget allocation, identify underperforming ad copy, and improve bidding strategies.
SEO reporting tracks organic search performance. An SEO report includes keyword rankings, organic impressions and clicks from Google Search Console, landing page performance, technical health indicators, and share of voice in organic search results. SEO reports are longer-cycle documents because organic rankings respond more slowly to changes than paid campaigns.
Search Engine Marketing reports integrate both. A complete SEM report uses paid data from Google Ads and Microsoft Advertising alongside organic data from Google Search Console and Google Analytics 4 to show how the two channels interact. For example, branded searches that appear in both paid and organic results require a combined view to understand true Cost Per Acquisition and avoid double-counting attribution.
The lines between these report types blur further when AI platforms enter the picture. AI overviews now appear above traditional organic results on Google, and answer engines like Perplexity and ChatGPT surface vendor recommendations that influence buyers before they reach a search results page. A thorough SEM reporting framework in 2026 acknowledges that a brand's search landscape now includes positions in AI-generated answers, not just rankings on page one.
For agencies managing clients across paid and organic search, the practical approach is to build modular reports where stakeholders can see the paid layer, the organic layer, and the AI visibility layer separately or combined depending on their role and objectives.
As explained in the AI search engine optimization guide the gap between traditional SEM reporting and AI visibility measurement is widening, and teams that do not account for it risk misreading where their search performance is actually coming from.
KEY TAKEAWAY: SEM reports should integrate paid, organic, and increasingly AI visibility data into one coherent view, with separate layers for stakeholders who need different levels of detail.
The 10 Key Performance Indicators Every SEM Report Needs
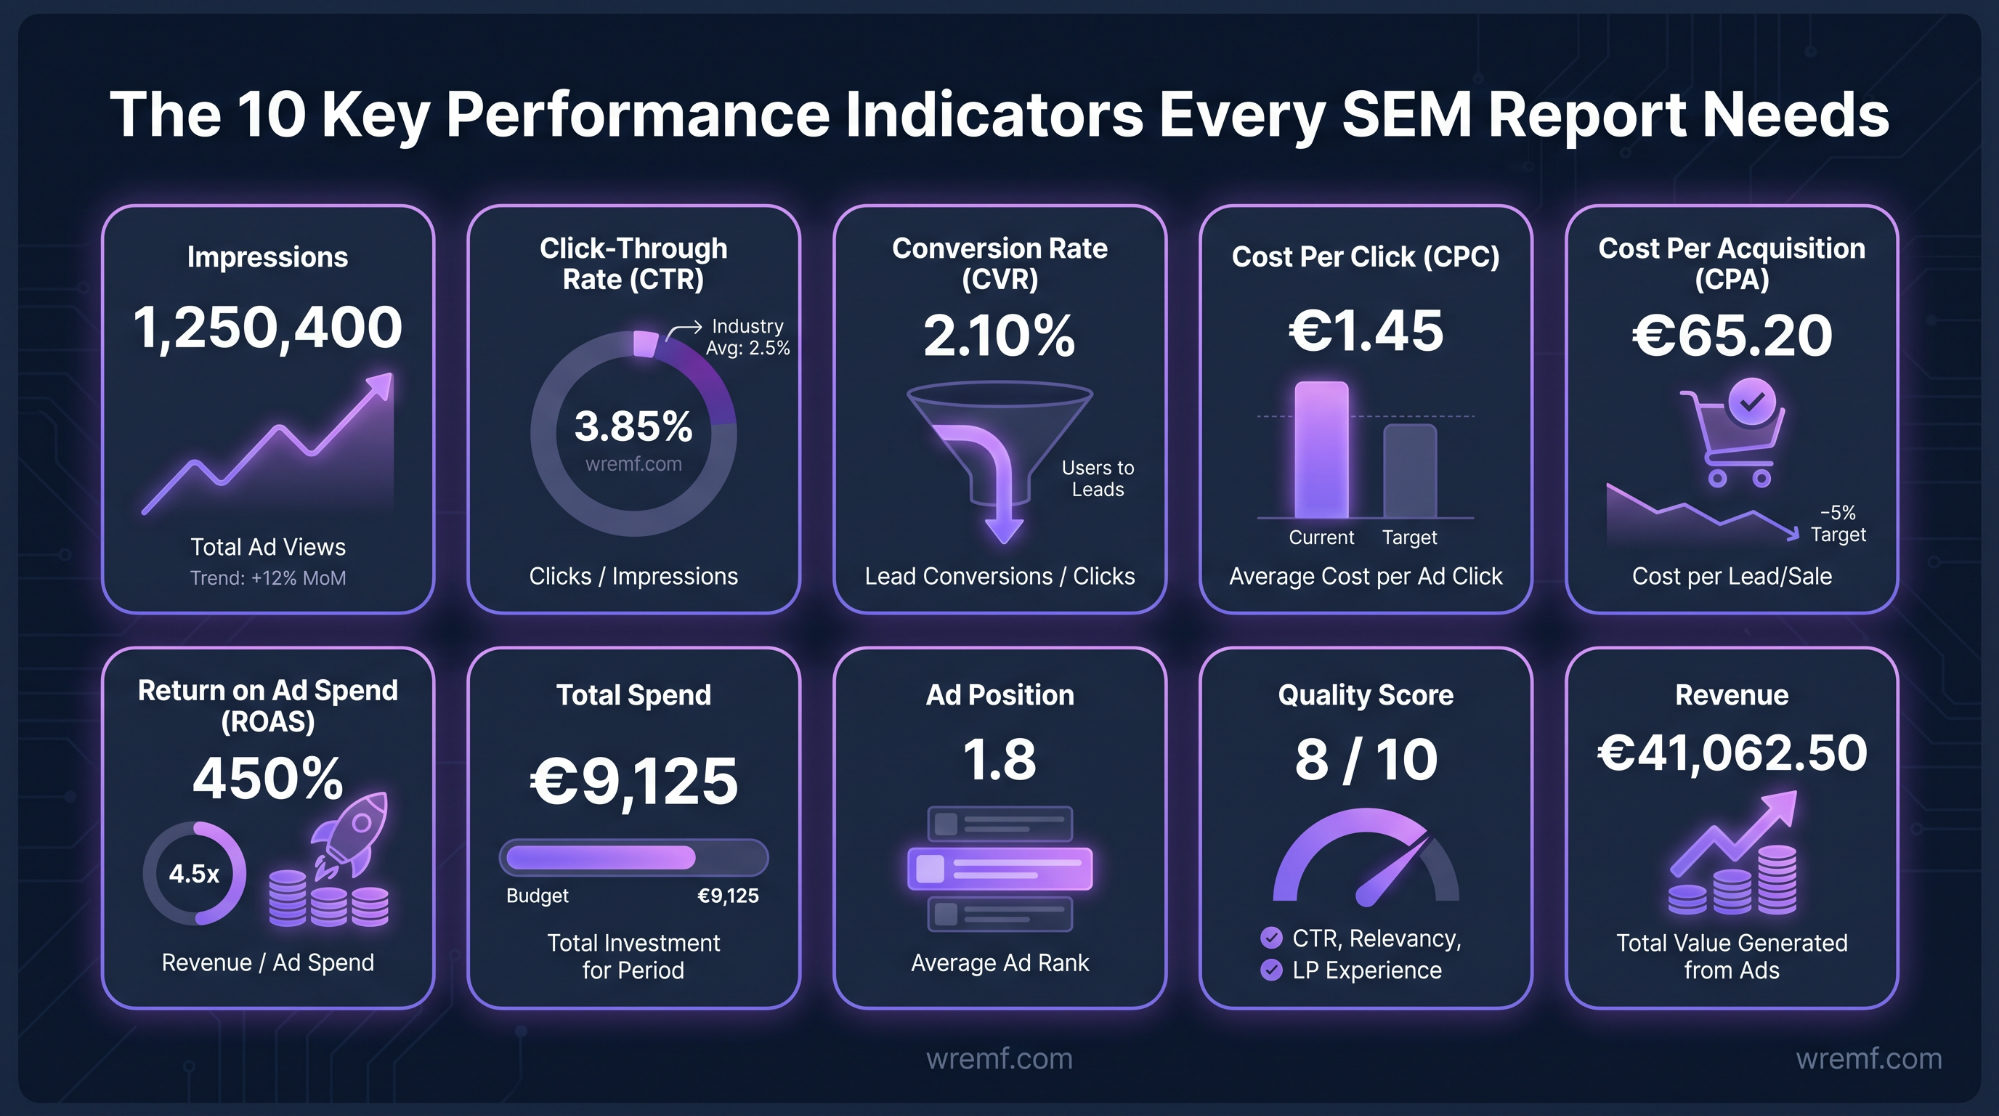
The most important KPIs for SEM reporting are the ones directly connected to campaign objectives and business outcomes. Including too many metrics dilutes focus; excluding the right ones leaves performance gaps invisible.
The following ten Key Performance Indicators form the foundation of a strong search engine marketing report.
Impressions measure how many times an ad or organic result appeared on a search engine result page. Impressions signal market reach and keyword coverage but carry little meaning without engagement context.
Click-Through Rate is the percentage of impressions that result in a click. Click-Through Rate is the primary indicator of ad copy relevance and landing page promise alignment. A low CTR on a high-impression campaign often signals a mismatch between the keyword intent and the message being served.
Cost Per Click measures the average amount paid for each click in a paid campaign. Cost Per Click sits at the intersection of bidding strategy, quality score, and competition. Higher Cost Per Click without proportional conversion improvement signals inefficiency.
Conversion rate measures the percentage of clicks that result in a defined action, such as a form fill, demo request, or purchase. Conversion rate connects traffic quality to business outcomes and is the most direct indicator of landing page performance and audience alignment.
Return on Ad Spend calculates revenue generated for every unit of currency spent on advertising. Using a simple example: if a campaign generates $4,000 in revenue from $2,000 in ad spend, the ROAS is 2x. ROAS is the primary financial metric for evaluating paid campaign efficiency.
Cost Per Acquisition measures the total cost required to acquire one customer or conversion. Cost Per Acquisition combines ad spend with conversion volume and is essential for understanding whether campaigns are profitable relative to Customer Lifetime Value.
Quality score is Google Ads' internal rating of the relevance and experience quality of keywords, ad copy, and landing pages. Quality score directly influences ad position and Cost Per Click, making it a leading indicator of paid search efficiency.
Impression share measures the percentage of eligible impressions an ad actually received. Low impression share often indicates budget constraints or quality issues, and it provides a ceiling estimate for performance improvement potential.
Keyword rankings track where organic content appears on the search results page for target queries. Keyword rankings from Google Search Console reveal content performance trends and competitive positioning across SEO reports and SEM reporting equally.
Revenue attribution connects campaign activity to actual revenue outcomes by tracking the full conversion path from click to close. Without revenue attribution, reports measure activity rather than business impact.
Teams using Google Analytics 4 can connect GA4 attribution to these KPIs across campaigns, channels, and audience segments. GA4's event-based model provides more granular conversion tracking than its predecessor, making it a better foundation for comprehensive SEM reporting.
DID YOU KNOW:
Google Analytics 4 uses an event-based data model that captures the full customer journey across sessions, devices, and channels, enabling more accurate multi-touch attribution than session-based analytics platforms.
KEY TAKEAWAY: Strong SEM reporting requires exactly ten foundational KPIs tied to business objectives, not a complete list of every available metric from every platform.
How to Build a Search Engine Marketing Report That Drives Decisions
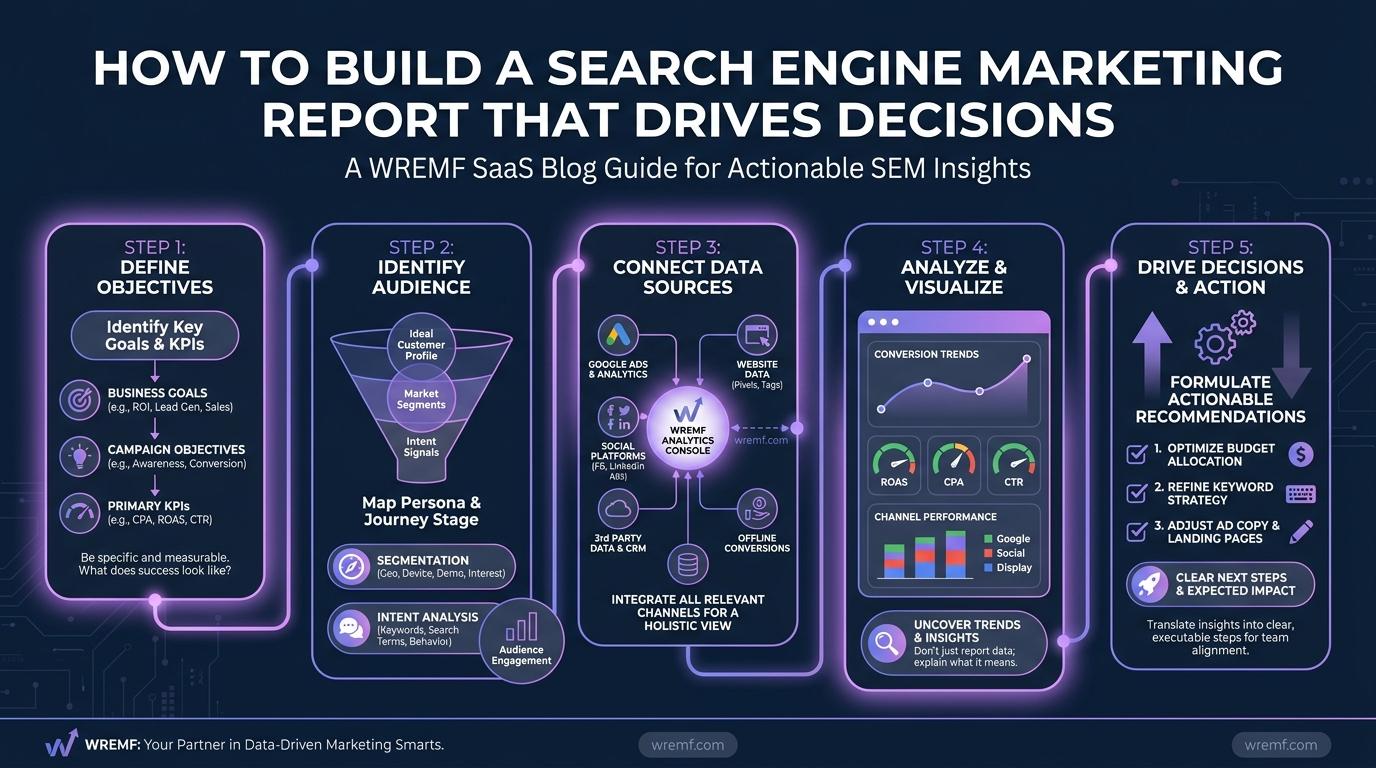
Building a search engine marketing report that drives decisions requires a clear process, not just access to data. Teams that export raw numbers from Google Ads and call it a report produce documentation, not intelligence.
Step 1: Define the reporting objective before pulling any data.
Every report should answer a specific question tied to a business objective. Is the report measuring campaign efficiency, diagnosing a performance drop, justifying budget, or recommending a strategic change? The objective determines which metrics matter and how the report is structured.
Step 2: Identify your audience and segment the report accordingly.
Stakeholders such as CMOs and finance leaders need revenue attribution, Return on Ad Spend, and Cost Per Acquisition. PPC teams and campaign managers need keyword performance, quality score, ad position, impression share, and ad copy analysis. Marketing teams working on content strategy need landing page performance, search intent alignment, and keyword research insights. Build separate views or use role-based access controls so each audience gets relevant data without noise.
Step 3: Connect your data sources.
A complete SEM report pulls from Google Ads, Google Analytics 4, Google Search Console, and any additional platforms such as Microsoft Advertising, LinkedIn Ads, or Facebook Ads that are active in the campaign mix. Data stitching across these sources is essential for accurate attribution. Tools such as Looker Studio, Power BI, and Zoho Analytics help teams build unified dashboards without manual export cycles. Agencies using AgencyAnalytics or similar platforms can consolidate multi-client data into white-label reports with automated report generation.
Step 4: Choose the right reporting cadence.
Weekly reports suit active campaign management and anomaly detection. Monthly reports suit strategic review and trend analysis. Quarterly reports suit stakeholder communication, budget justification, and business outcomes review. The cadence should match the decision cycle of the audience, not the preference of the person building the report.
Step 5: Include trend analysis, not just point-in-time snapshots.
A single week of impression data tells you nothing useful. Trend lines over 30, 60, and 90 days reveal whether performance is improving, plateauing, or declining. If the dataset is large enough, forecasting the projected trajectory over the next 60 days gives campaign managers early warning to adjust before performance drops become crises.
Step 6: Add competitor and share of voice context.
Search engine marketing reports that show only internal performance miss the competitive dimension. Including impression share, keyword overlap, and share of voice data helps teams understand whether performance changes reflect internal decisions or shifts in the broader search landscape.
Step 7: End every report with a clear next action.
Every report section should conclude with a recommendation. Not a recommendation to "monitor performance," but a specific action such as pausing a keyword set, revising landing page copy, reallocating budget from a campaign with poor ROAS to one with strong conversion rate, or expanding into a keyword cluster that shows rising search intent.
Step 8: Integrate AI visibility data into the reporting framework.
Organic rankings and paid placements no longer capture the full picture of where buyers encounter a brand. AI overviews appear above organic results on Google. ChatGPT and Perplexity are used to research vendors before a search results page is ever visited. Including Share of Voice in AI Answers and AI recommendations alongside traditional SEM metrics gives stakeholders a complete view of brand performance in the evolving search landscape.
Teams that want a full picture of their AI visibility alongside paid and organic search performance can explore WREMF pricing plans to see which plan matches their reporting needs.
KEY TAKEAWAY: Building a decision-driving SEM report requires eight structured steps from objective definition through to AI visibility integration, with every section ending in a specific recommended action.
SEM Reporting Tools and Dashboard Options for Different Team Sizes
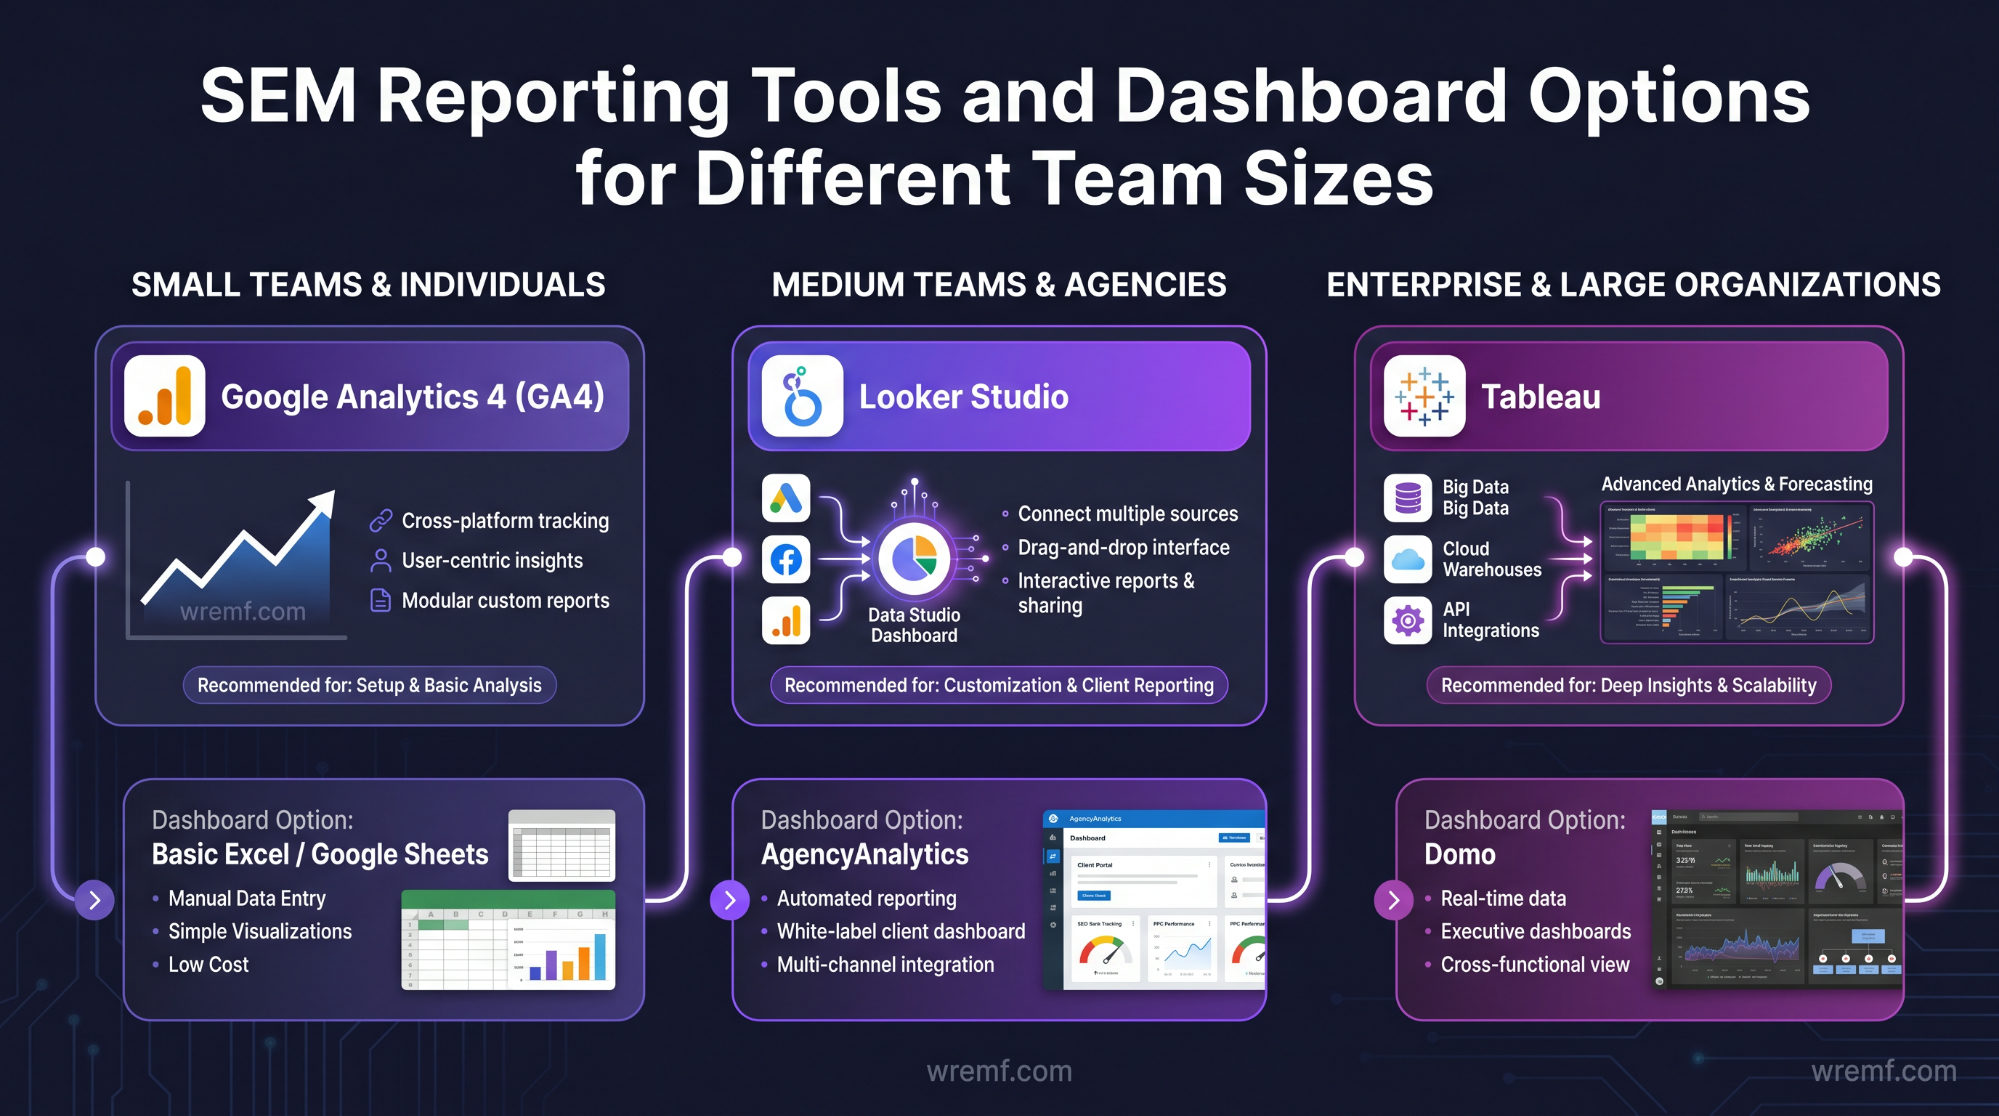
The right SEM reporting tool depends on team size, client volume, technical capacity, and how deeply the team needs to integrate data across platforms. No single tool is optimal for every scenario.
For small teams and solo consultants, Google Analytics 4 combined with Google Search Console provides a solid free foundation for tracking organic and paid search performance. Google Ads native reporting covers campaign-level PPC data. The limitation is that these tools require manual assembly for comprehensive SEM reports, and they do not integrate offline conversion data or AI visibility data natively.
For B2B marketing teams needing integrated dashboards, Looker Studio connects Google Ads, Google Analytics 4, Google Search Console, and third-party connectors into a single visual dashboard. Looker Studio is free, flexible, and widely used by SEO reporting and PPC teams. Power BI and Zoho Analytics offer similar integration capability with stronger enterprise-grade data governance and role-based access controls.
For agencies managing multiple clients, platforms such as AgencyAnalytics, DashThis, Reporting Ninja, and Reportz.io automate report generation across client accounts. These tools support white-label reporting, scheduled delivery, and multi-channel integration across Google Ads, Facebook Ads, LinkedIn Ads, Microsoft Advertising, TikTok, and other paid channels. The value for agencies is time saved on manual report generation and the ability to maintain consistent reporting cadence across accounts.
SearchAds 360 is relevant for larger enterprise teams and agencies managing complex paid search operations across Google and Microsoft Advertising at scale. It provides unified campaign management, advanced attribution, and cross-engine reporting in one interface.
Semrush provides combined paid and organic Search marketing intelligence, including keyword research, competitor analysis, SERP features tracking, and content performance data. The Semrush AI SEO toolkit adds AI-specific visibility signals for teams that want to track how their content performs in AI-influenced search environments.
For teams that need to extend reporting into revenue attribution and Customer Lifetime Value analysis, integrating Google Analytics 4 with a CRM such as HubSpot or Salesforce enables lead scoring, offline conversion data import, and full-funnel revenue attribution that standard SEM reporting tools do not provide natively.
Google Analytics help documentation provides guidance on setting up conversion tracking, GA4 attribution models, and data integration across marketing platforms.
For teams that need to add AI visibility measurement to their SEM dashboard, WREMF provides prompt-level tracking, source citation tracking, AI share of voice, and AI referral traffic analysis across ten AI engines. Teams using WREMF Growth can connect to Looker Studio directly for unified reporting that covers paid, organic, and AI surfaces in one place, as described in the AI SEO tools guide
KEY TAKEAWAY: SEM reporting tool selection should match team size, client volume, and data integration needs, with AI visibility tracking added as a separate layer for teams whose audiences are using AI engines to research vendors.
AI Visibility Data and the Expanding SEM Reporting Framework
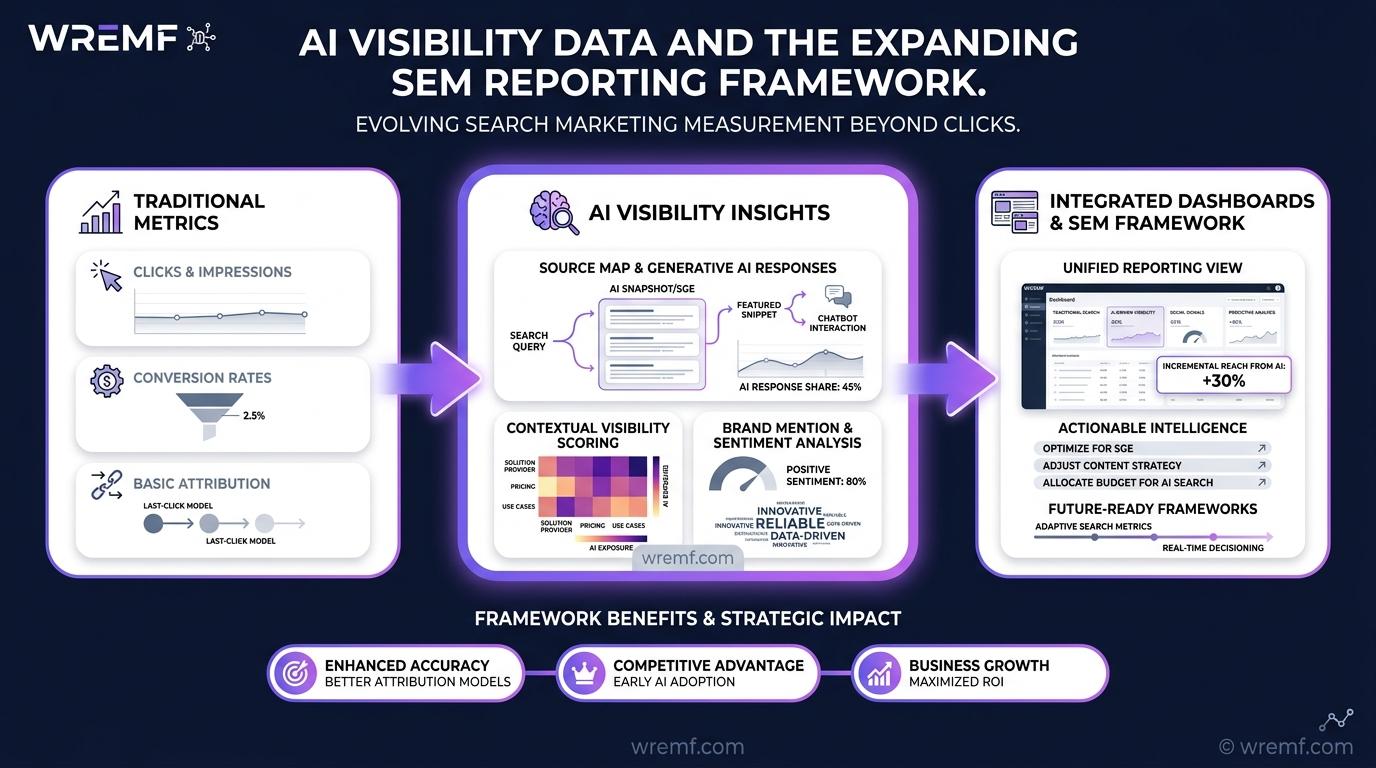
AI visibility data belongs in modern search engine marketing reports because buyers increasingly use AI engines to research and shortlist vendors before reaching a search results page. Teams that only track Google Ads and organic rankings are measuring an incomplete version of their search presence.
AI overviews now appear in Google Search above traditional organic results, and according to Google's AI Overviews documentation these summaries draw from a separate set of source signals than standard organic rankings. A brand can rank on page one for a target keyword and still be absent from the AI overview that appears above those results.
Beyond Google, platforms such as ChatGPT, Perplexity, Gemini, Claude, Copilot, DeepSeek, Grok, Meta AI, and Mistral are generating answers to commercial research prompts without showing a traditional SERP. When a buyer asks one of these platforms which B2B SaaS tools they should evaluate, the brands that appear in the generated answer have a significant advantage. The brands that do not appear are effectively invisible to that buyer at that moment, regardless of their Google Ads spend or keyword rankings.
AI visibility data in SEM reporting covers several distinct signals. Share of Voice in AI Answers measures what percentage of relevant AI-generated responses mention or recommend a brand relative to competitors. Source citations track which pages are being used as references by AI engines when generating answers. AI recommendations track how frequently and in what context a brand is named as a suggested solution. Brand performance in AI answers tracks whether the brand is described accurately, positively, and in a way that matches the intended market positioning.
Connecting these signals to traditional SEM reporting creates a fuller picture of attribution gaps. A campaign might generate strong click volume but the brand's absence from AI answers means a portion of the target audience never reached the point of clicking anything at all.
WREMF tracks AI visibility across ten engines, including ChatGPT, Gemini, Claude, Perplexity, Copilot, DeepSeek, Grok, Meta AI, and Mistral, providing prompt-level reporting, source citation analysis, and AI share of voice data that can be integrated alongside GA4 attribution and traditional SEM metrics. Further context on this approach is available in the AI mention tracking guide
For teams with strong internal execution capacity, WREMF Starter at €59 per month provides core prompt intelligence, source citation tracking, and AI Visibility Index for a single website. Growth teams managing multiple brands or client accounts can use WREMF Growth at €149 per month for advanced citation tracking, AI share of voice, GEO audits, and Looker Studio integration alongside their existing SEM dashboard.
KEY TAKEAWAY: AI visibility data is a necessary addition to modern SEM reporting because buyers research vendors in AI engines before reaching Google, and a brand can have strong paid rankings while being completely absent from AI-generated answers.
Connecting SEM Metrics to Business Goals and Revenue Attribution
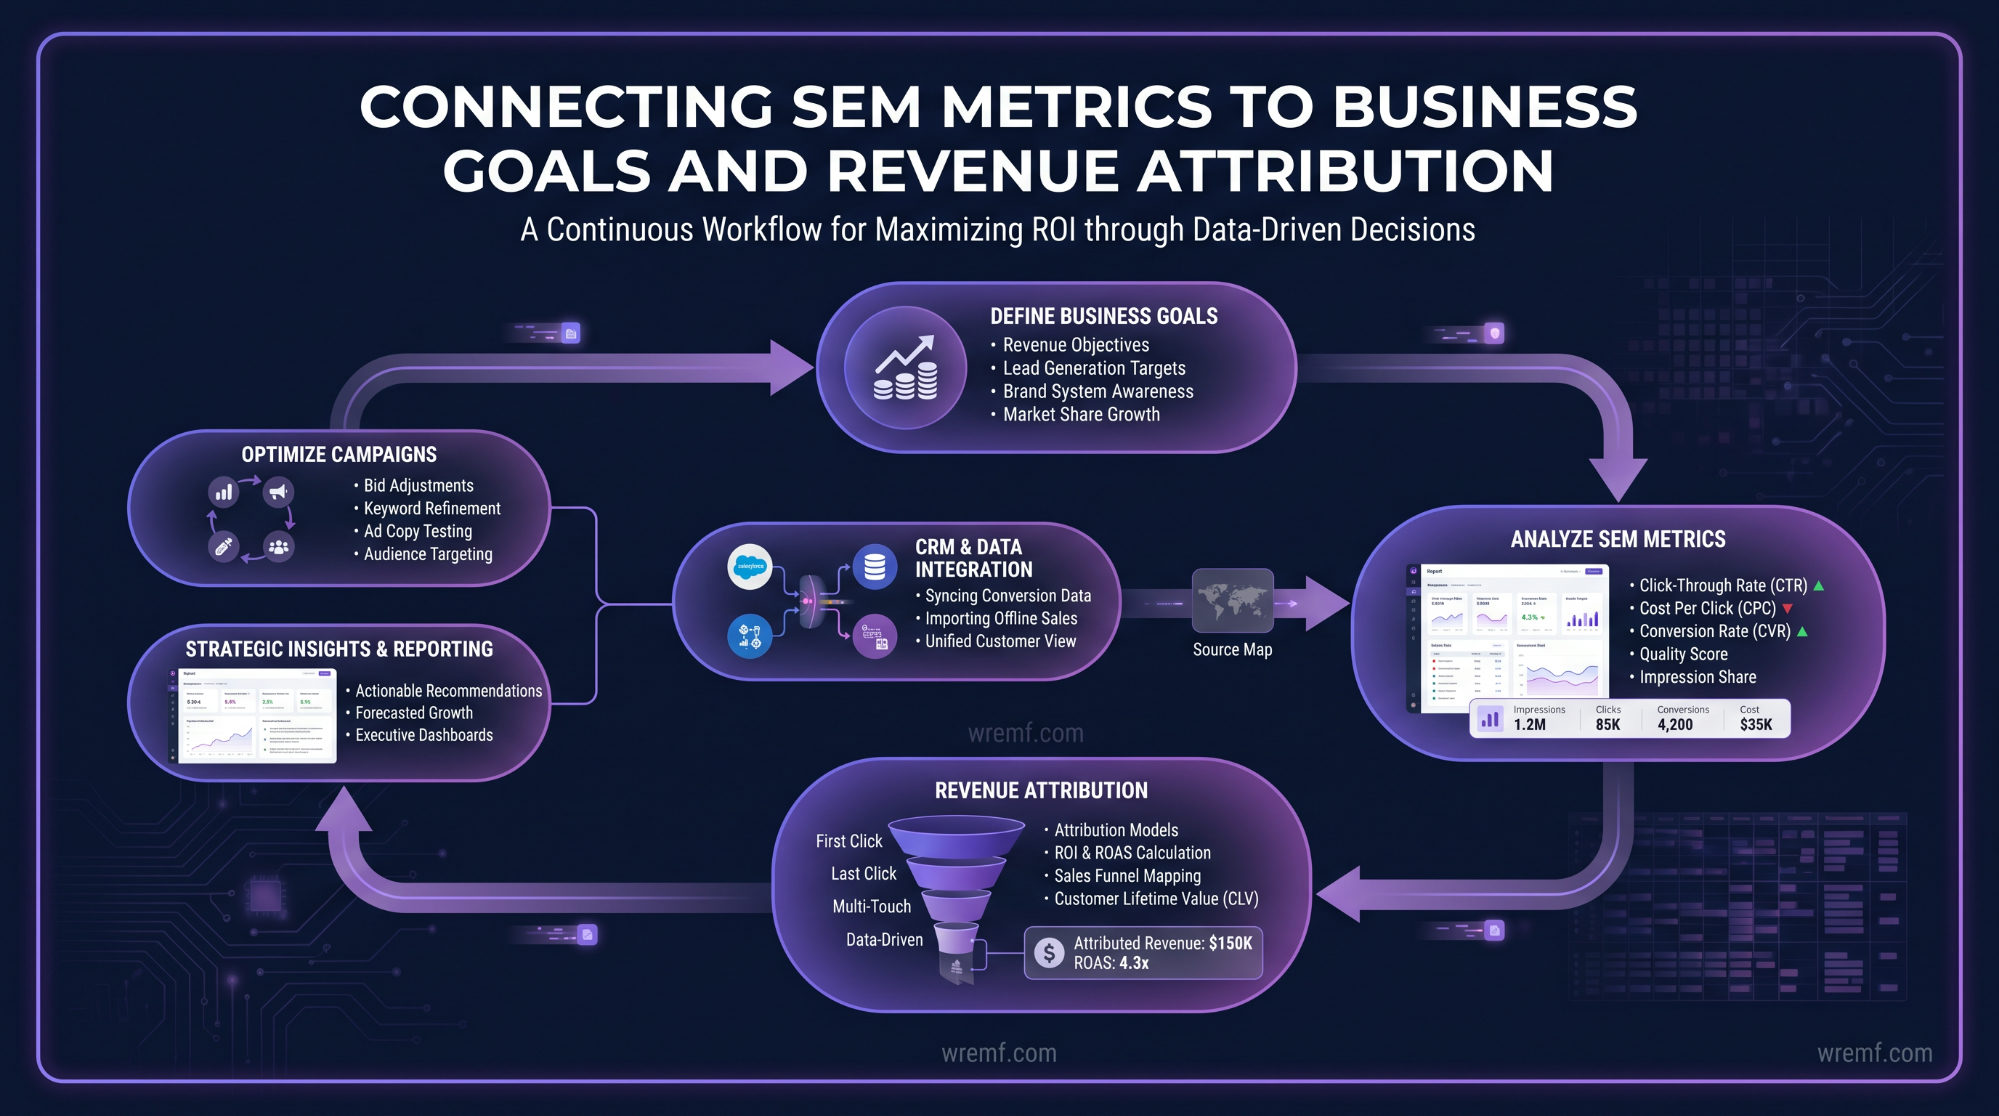
SEM metrics only justify investment when they connect directly to business outcomes rather than stopping at Click-Through Rate or Cost Per Click. Revenue attribution is the bridge between campaign performance and commercial value.
The core challenge in B2B SEM reporting is that the conversion cycle is long and multi-touch. A buyer might see a paid ad, click an organic result, read a piece of Content Marketing, engage with a LinkedIn Ads retargeting campaign, and finally convert after receiving a direct Email Marketing message. Standard last-click attribution assigns all credit to the final touchpoint, which consistently undervalues upper-funnel campaigns and makes it difficult for marketing teams to justify awareness-stage spend.
Google Analytics 4 addresses part of this problem through its data-driven attribution model, which uses machine learning to distribute conversion credit across the full customer journey. Teams that implement GA4 attribution properly and connect it to their Google Ads campaigns can see which keyword strategies, campaigns, and landing pages are contributing to qualified leads and revenue, not just clicks.
For E-commerce teams, Revenue attribution connects directly to purchase data, making ROAS and Customer Acquisition Cost easier to calculate with precision. For B2B SaaS and service businesses, revenue attribution requires connecting campaign data to CRM records, which often involves importing offline conversion data from Salesforce or HubSpot back into Google Ads and GA4.
Customer Lifetime Value is an important addition to SEM reporting for subscription businesses. A campaign with a high Cost Per Acquisition may still be profitable if the customers acquired have high lifetime value. Without CLV data in the report, stakeholders may cut campaigns that are actually the most profitable over a 12 to 24 month horizon.
The metrics that matter most depend on the business scenario. For campaigns focused on lead generation, Cost Per Acquisition and qualified leads are primary. For brand awareness campaigns, impressions, impression share, and cost-per-thousand impressions matter more. For bottom-funnel conversion campaigns, conversion rate, Return on Ad Spend, and revenue attribution are the headline numbers.
Aligning the report structure to the campaign objective, rather than presenting all metrics regardless of relevance, is what makes SEM reporting useful to stakeholders rather than overwhelming.
KEY TAKEAWAY: Revenue attribution connects SEM campaign activity to commercial outcomes, and teams that implement GA4 attribution alongside CRM data can report on qualified leads, Customer Acquisition Cost, and Customer Lifetime Value rather than surface-level click metrics.
Reporting for Different Stakeholders: Executives, Agencies, and Campaign Teams
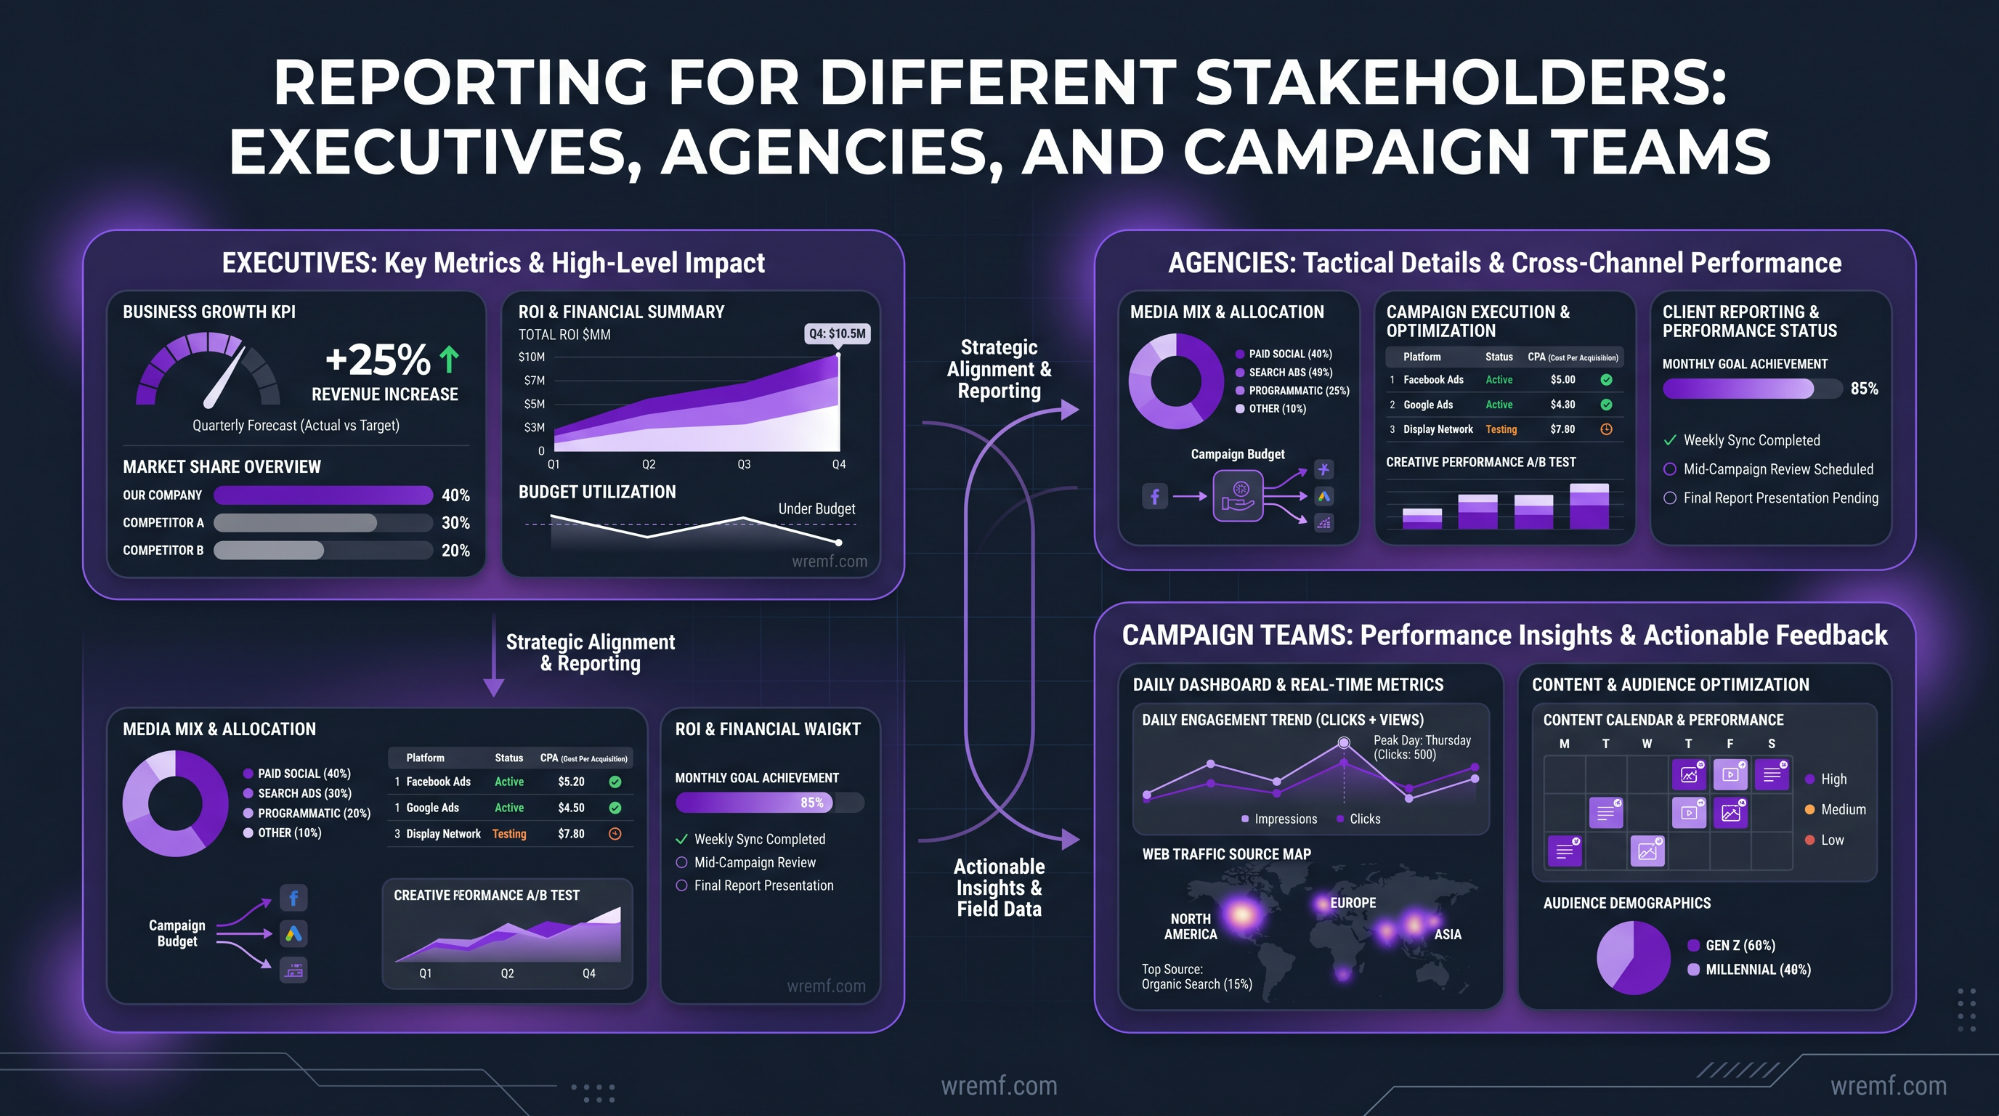
Different stakeholders require different versions of the same search engine marketing report. Executives need revenue impact. Campaign managers need tactical detail. Agency clients need clarity without complexity.
For C-suite stakeholders and business owners, SEM reports should lead with business outcomes rather than campaign mechanics. The executive view should surface Return on Ad Spend, total revenue attributable to search campaigns, Cost Per Acquisition versus target, and a clear recommendation for budget allocation. Executives do not need to know the quality score of every keyword. They need to know whether the investment is working and what the plan is to improve it.
For PPC teams and campaign managers, the report needs full granularity. This layer covers individual keyword performance, ad position, Click-Through Rate by ad copy variant, landing page conversion rates, quality score trends, impression share by campaign, audience behavior patterns, and anomaly detection flags. This is where attribution gaps get diagnosed, keyword intent mismatches get identified, and ad copy testing decisions get made.
For agency clients, the report must communicate clearly to non-specialists. Avoid jargon where possible, anchor every metric to a business outcome, and use visual summaries before diving into data tables. White-label reports generated through platforms like AgencyAnalytics or Looker Studio allow agencies to present branded, polished search engine marketing reports that build client confidence without requiring clients to log into multiple platforms.
For Content marketing strategists and website designers involved in landing page optimization, reports should highlight which landing pages are converting well, which have high bounce rates relative to their click volume, and which keyword clusters are driving the most engaged visitors. Connecting SEM reporting to content performance data helps content teams prioritize updates and avoid content decay on pages that are receiving paid traffic but failing to convert.
For developers working on technical implementation, reporting should surface technical health signals such as landing page load speed, mobile performance for Smartphones traffic, and conversion tracking accuracy. Broken conversion tracking is one of the most common sources of misleading SEM data, and developers need to be included in the reporting loop when technical issues are suspected.
As discussed in the answer engine optimization guide aligning content teams and SEM teams around shared visibility data is increasingly important as AI answers change which content influences buyer decisions before a paid click ever occurs.
KEY TAKEAWAY: Effective SEM reporting requires separate layers for executives, campaign managers, agency clients, and technical teams, with each layer surfacing only the metrics and recommendations relevant to that audience's decisions.
Automating Search Engine Marketing Reports and Reducing Manual Work
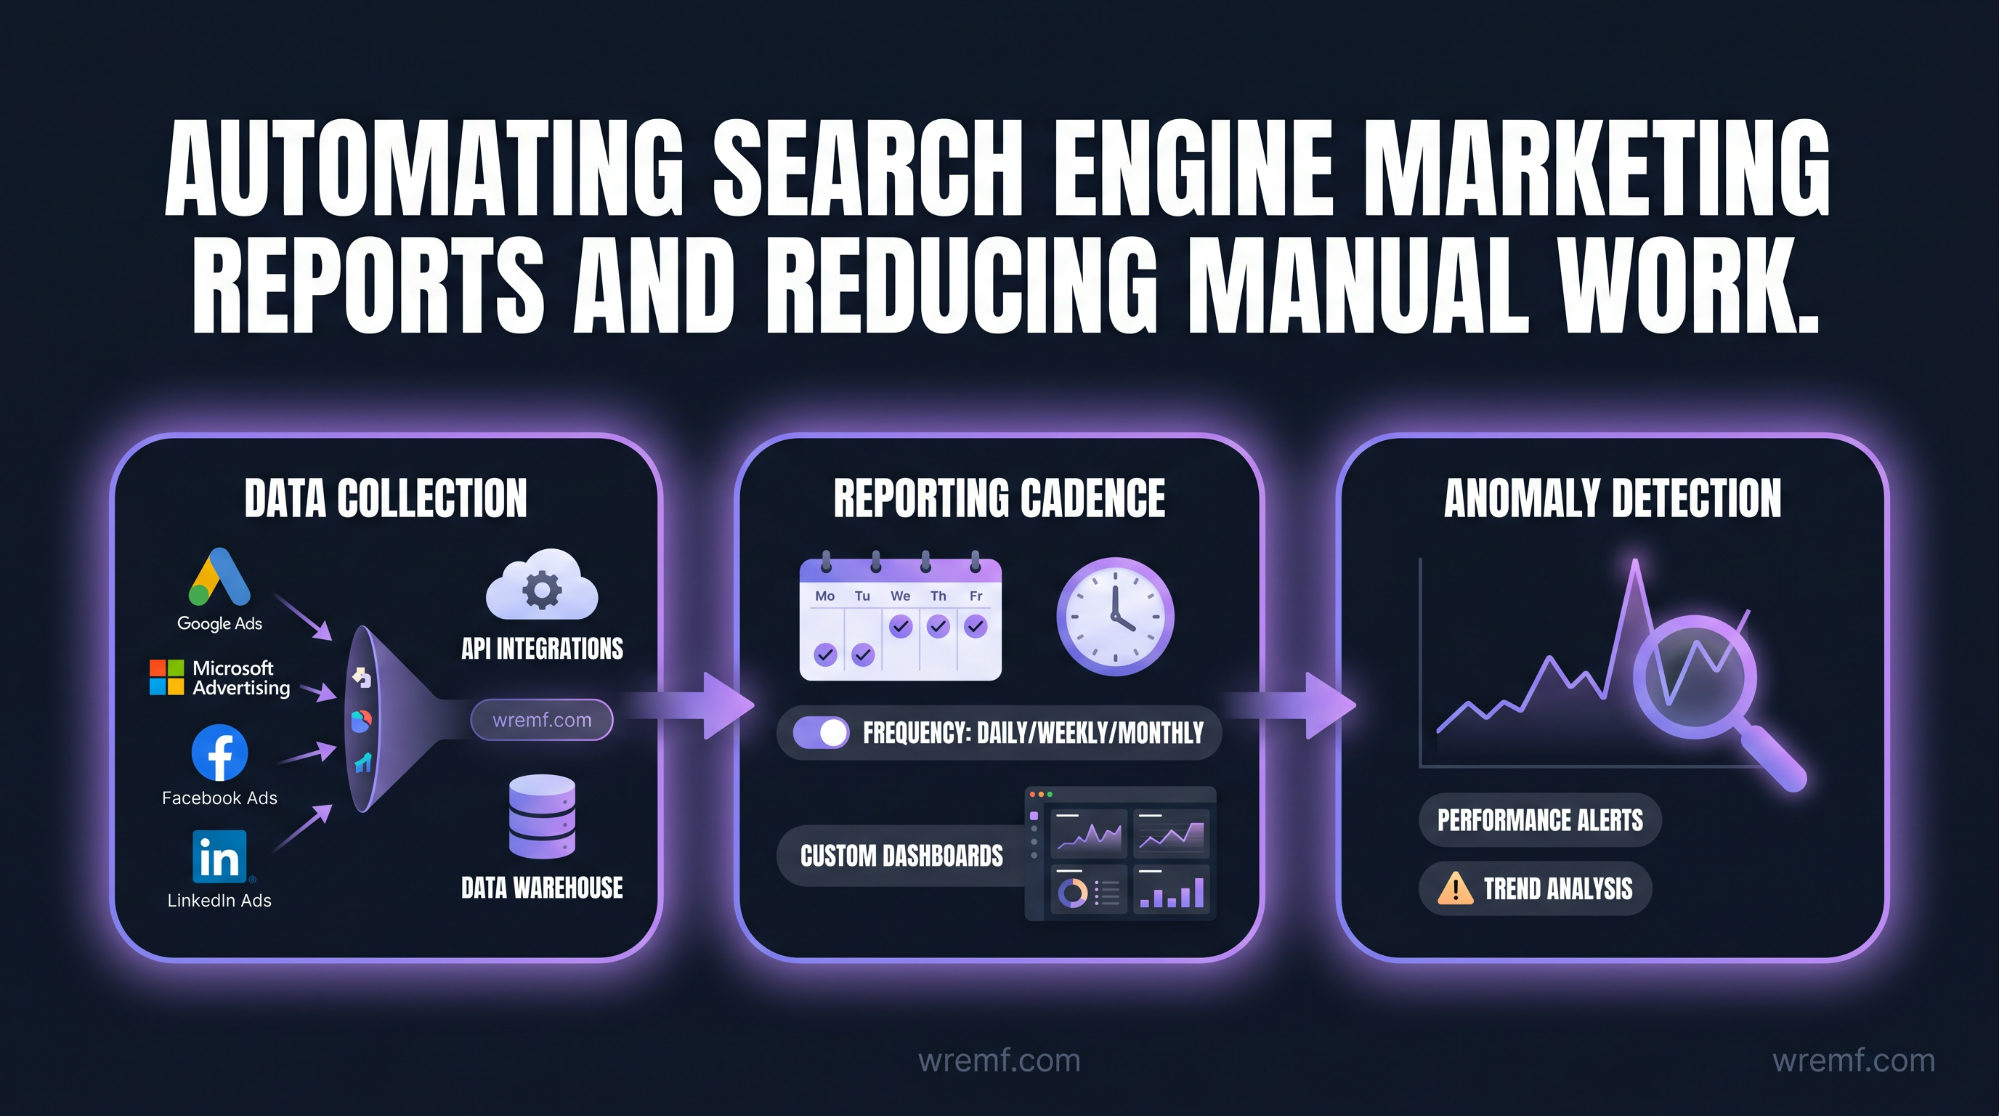
Automated report generation saves agencies and in-house teams significant time while improving reporting consistency and reducing human error. Manual SEM reporting is one of the largest inefficiencies in marketing operations.
The automation opportunity exists at every stage of the reporting process: data collection, data stitching, dashboard refresh, scheduled delivery, and commentary generation. Teams that automate each of these stages can shift time from building reports to analysing them.
Data collection automation starts with connecting platforms directly to a reporting layer rather than manually exporting CSVs. Google Ads, Google Analytics 4, Facebook Ads, Microsoft Advertising, LinkedIn Ads, TikTok, and Google Search Console all have APIs that feed into tools like Looker Studio, Power BI, DashThis, Reporting Ninja, and AgencyAnalytics without manual intervention.
Data stitching is the process of combining data from multiple platforms into a unified dataset that can be queried consistently. For example, stitching Google Ads spend data with GA4 conversion data and Google Search Console organic click data into one model allows teams to see the total paid and organic search investment and return in a single view. Platforms like SearchAds 360, Zoho Analytics, and Campaign Manager support this kind of multi-channel integration at enterprise scale.
Automated report generation through tools like AgencyAnalytics and Reportz.io allows agencies to schedule weekly or monthly reports for every client account, apply white-label branding, and deliver reports via email without manual assembly. FAII.ai is an emerging tool in this category that uses AI to surface anomaly detection and narrative commentary alongside performance data, reducing the burden on analysts to manually identify what changed and why.
Scheduling automation is straightforward but often overlooked. Reports should be delivered on a fixed cadence tied to the decision cycle of the recipient. Weekly campaign summaries for PPC teams. Monthly strategic reviews for stakeholders. Quarterly business outcome reviews for executives. Automation tools enforce cadence discipline even when internal teams are under pressure.
For teams that want to include AI visibility data in automated reports, WREMF supports scheduled AI monitoring and provides white-label client reporting alongside its prompt intelligence and source citation tracking capabilities. The Growth plan includes Looker Studio connector integration so AI visibility data can be embedded in the same dashboard used for traditional SEM reporting.
KEY TAKEAWAY: Automating data collection, stitching, and report delivery frees marketing teams to focus on analysis and action rather than manual assembly, and modern platforms can handle the entire reporting pipeline from data ingestion to stakeholder delivery.
Advanced SEM Reporting: Predictive Analytics, Anomaly Detection, and AI-Assisted Analysis
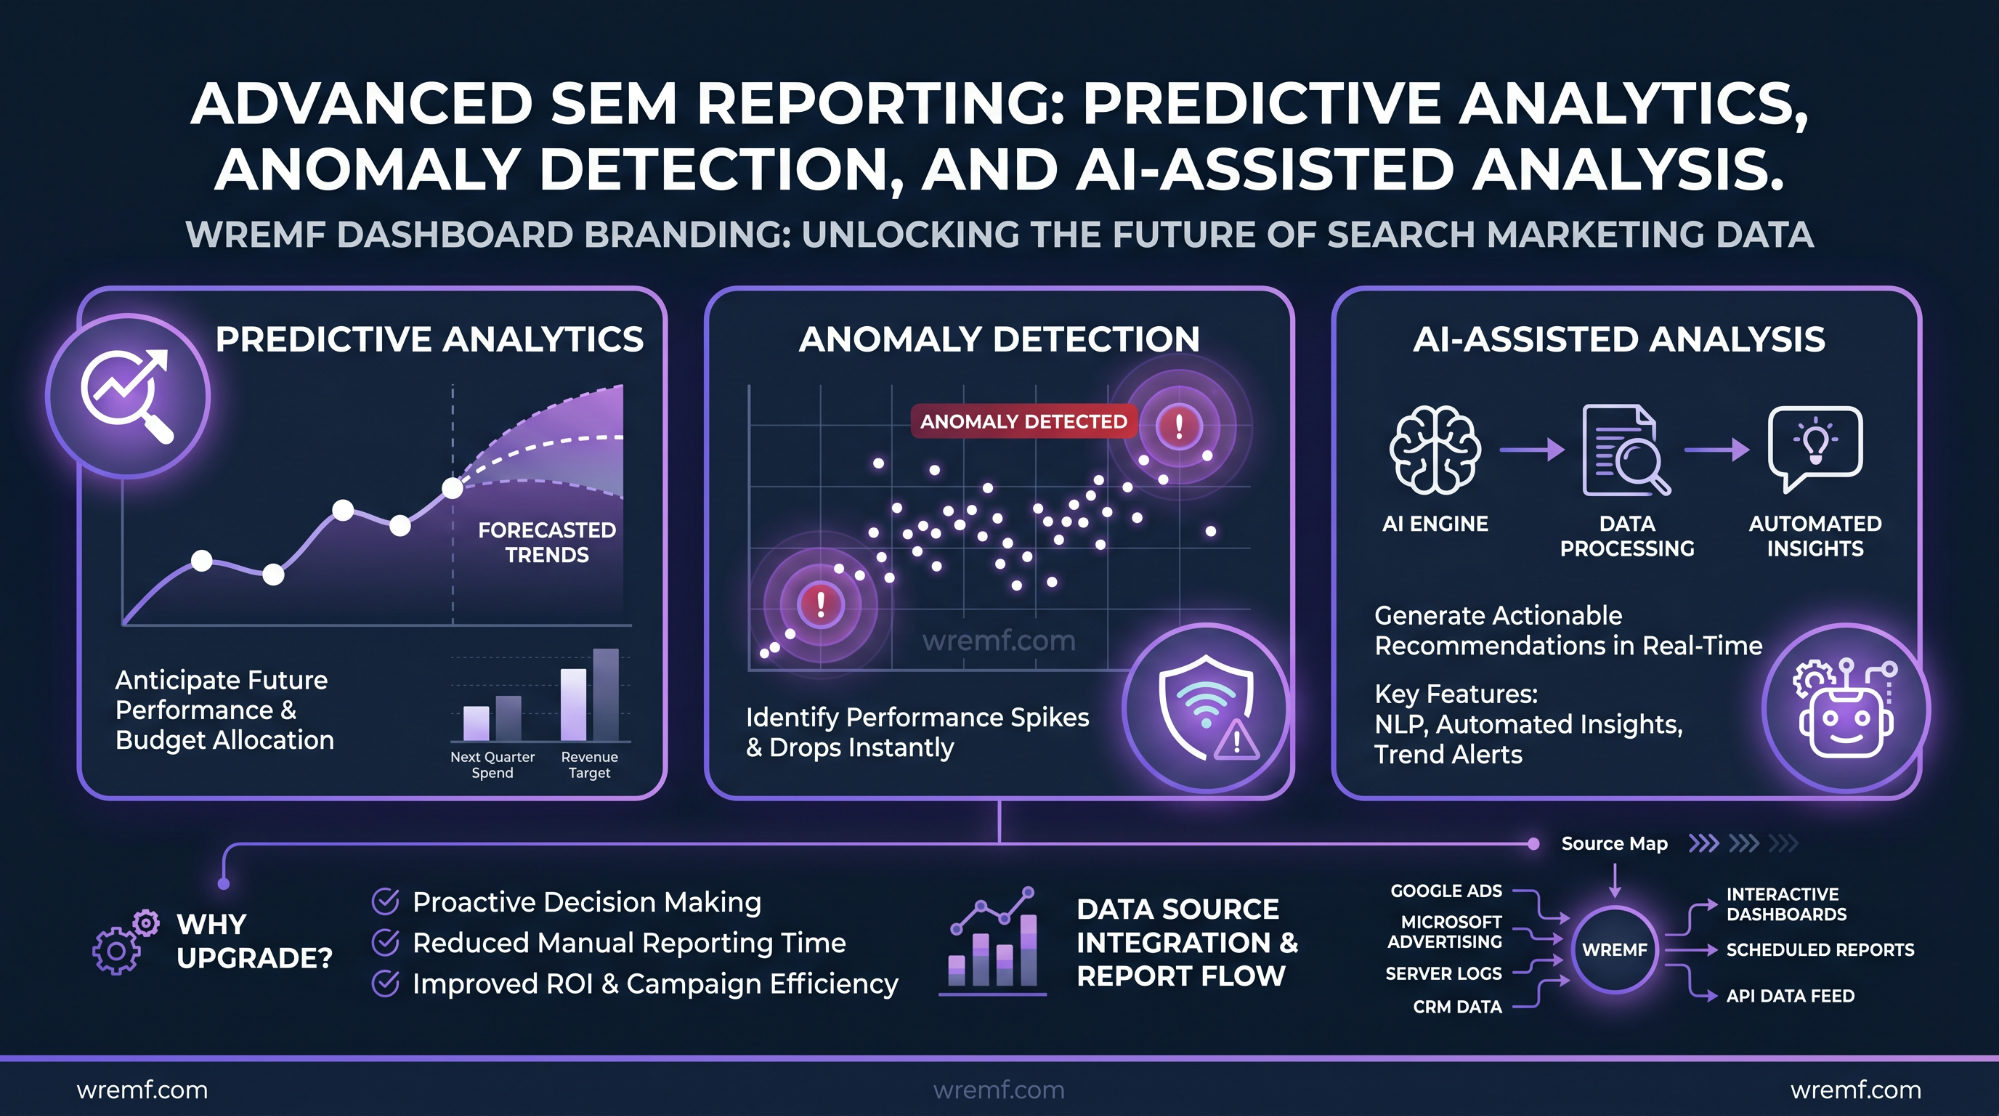
Advanced SEM reporting moves beyond describing what happened to predicting what will happen and automatically flagging when something unusual occurs. These capabilities are increasingly accessible to mid-market and enterprise teams.
Predictive analytics in SEM reporting uses historical campaign data to forecast future performance. If conversion volume is trending down across a 60-day window while Cost Per Click is rising, a predictive model can project the budget impact over the next quarter and surface the scenario before it becomes a crisis. Google Analytics 4 includes predictive metrics such as purchase probability and churn probability that can be incorporated into SEM reports for E-commerce and subscription businesses.
Anomaly detection identifies statistically significant deviations from expected performance without requiring a human analyst to review every data point daily. A sudden drop in conversion rate on a specific landing page, an unexpected spike in Cost Per Click for branded searches, or an unusual impression share decline in a key campaign can all be flagged automatically. Tools like Zoho Analytics and GA4 include anomaly detection features, and platforms like FAII.ai are building more sophisticated alert systems specifically for marketing data.
AI-assisted analysis is emerging as a practical addition to SEM reporting workflows. Rather than replacing human judgment, AI platforms can be used to summarise large datasets, identify patterns across keyword strategies, and generate draft commentary for reports. Some teams are using meeting transcripts from client or stakeholder reviews to feed context into AI tools and generate tailored report narratives. This is not a replacement for analytical thinking, but it does reduce the time between data availability and report delivery.
Multi-channel attribution is another advanced consideration. Most SEM reports still rely on last-click or data-driven models within a single platform, but buyer journeys in 2026 often involve YouTube Shorts, Podcasts, Audio content, LinkedIn Ads, and AI engine interactions before a search click occurs. Attribution models that account for these upstream touchpoints give marketing teams a more accurate view of what is actually influencing conversion.
According to McKinsey's AI insights marketing and sales functions are among the highest-value areas for AI adoption, and teams that integrate AI-assisted analysis into their reporting workflows are building a measurable operational advantage over those that do not.
KEY TAKEAWAY: Predictive analytics, anomaly detection, and AI-assisted analysis convert SEM reports from retrospective summaries into forward-looking intelligence tools that help teams act before problems compound.
SEM Reporting for Specific Channels: Google Ads, Microsoft Advertising, and Beyond
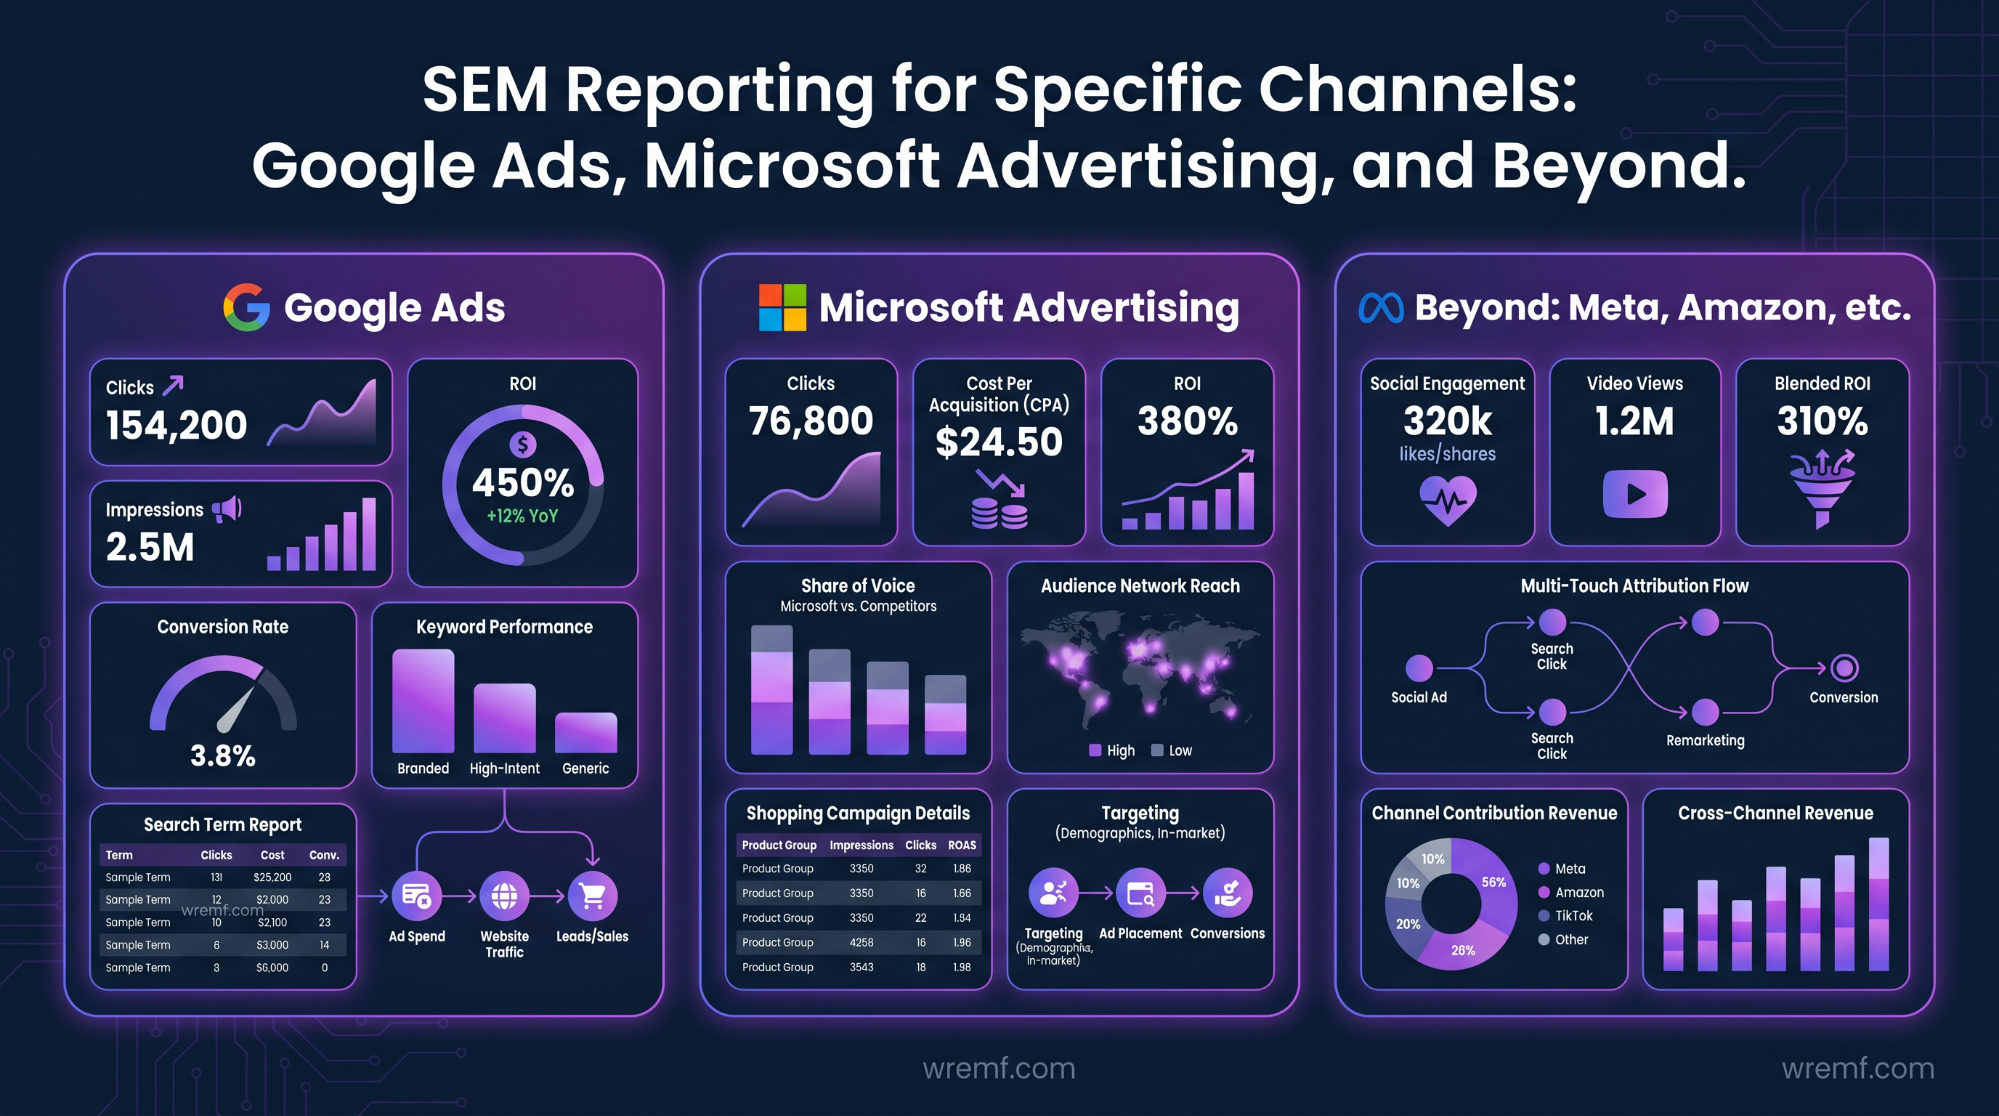
Channel-specific reporting matters because each paid search platform has different metrics, auction mechanics, and audience characteristics that require tailored analysis. Combining all channel data without segmentation produces misleading averages.
Google Ads remains the dominant paid search platform and is the anchor of most SEM reporting frameworks. Google Ads reporting covers campaigns, ad groups, keywords, ad copy, quality score, impression share, conversion tracking, and ROAS at granular levels. Google AdWords was the previous name for the platform, and teams referencing historical data may encounter both terms in legacy reports. The native reporting interface is comprehensive but benefits from being combined with GA4 attribution data to see the full conversion path rather than only the last click.
Microsoft Advertising, previously known as Bing Ads, covers a distinct user segment that skews older and often shows different keyword intent patterns than Google. While Google Ads is the larger network by audience volume, Microsoft Advertising often shows lower Cost Per Click for equivalent keyword strategies, which can produce strong ROAS for campaigns with sufficient budget to test both platforms. Including Microsoft Advertising data in SEM reports provides a competitive signal for keyword strategies that competitors may not be testing.
Facebook Ads and LinkedIn Ads are demand generation channels rather than pure intent capture, but they feed directly into search volume and branded searches when campaigns run at scale. Teams running awareness campaigns across social channels should track whether branded search impression volume and conversion rate change after campaign launches, as this connection often reveals upstream attribution that standard SEM reporting misses.
TikTok, YouTube Shorts, and Video Marketing increasingly influence buyer consideration for B2B audiences, particularly for brands targeting younger technical buyers. Including video engagement data in SEM reports as a supporting context layer, rather than a primary metric, helps stakeholders understand whether content investments are contributing to the awareness stage of the funnel.
Amazon advertising is relevant for E-commerce brands and should be reported alongside Google Ads data when both channels are active. Amazon campaign data requires separate integration because it does not flow into standard GA4 or Looker Studio setups without custom connectors.
Higher education institutions, university and college marketing teams, and Google My Business advertisers all use these platforms with different conversion objectives than commercial B2B brands. SEM reporting frameworks should be adapted to the specific business model, whether that is generating enquiries for higher education programs, driving local service leads, or acquiring software trial sign-ups.
KEY TAKEAWAY: Channel-specific SEM reporting segments paid performance by platform to reveal audience differences, cost efficiency variations, and attribution signals that aggregated reporting obscures.
Diagnosing Common SEM Performance Problems Through Reporting
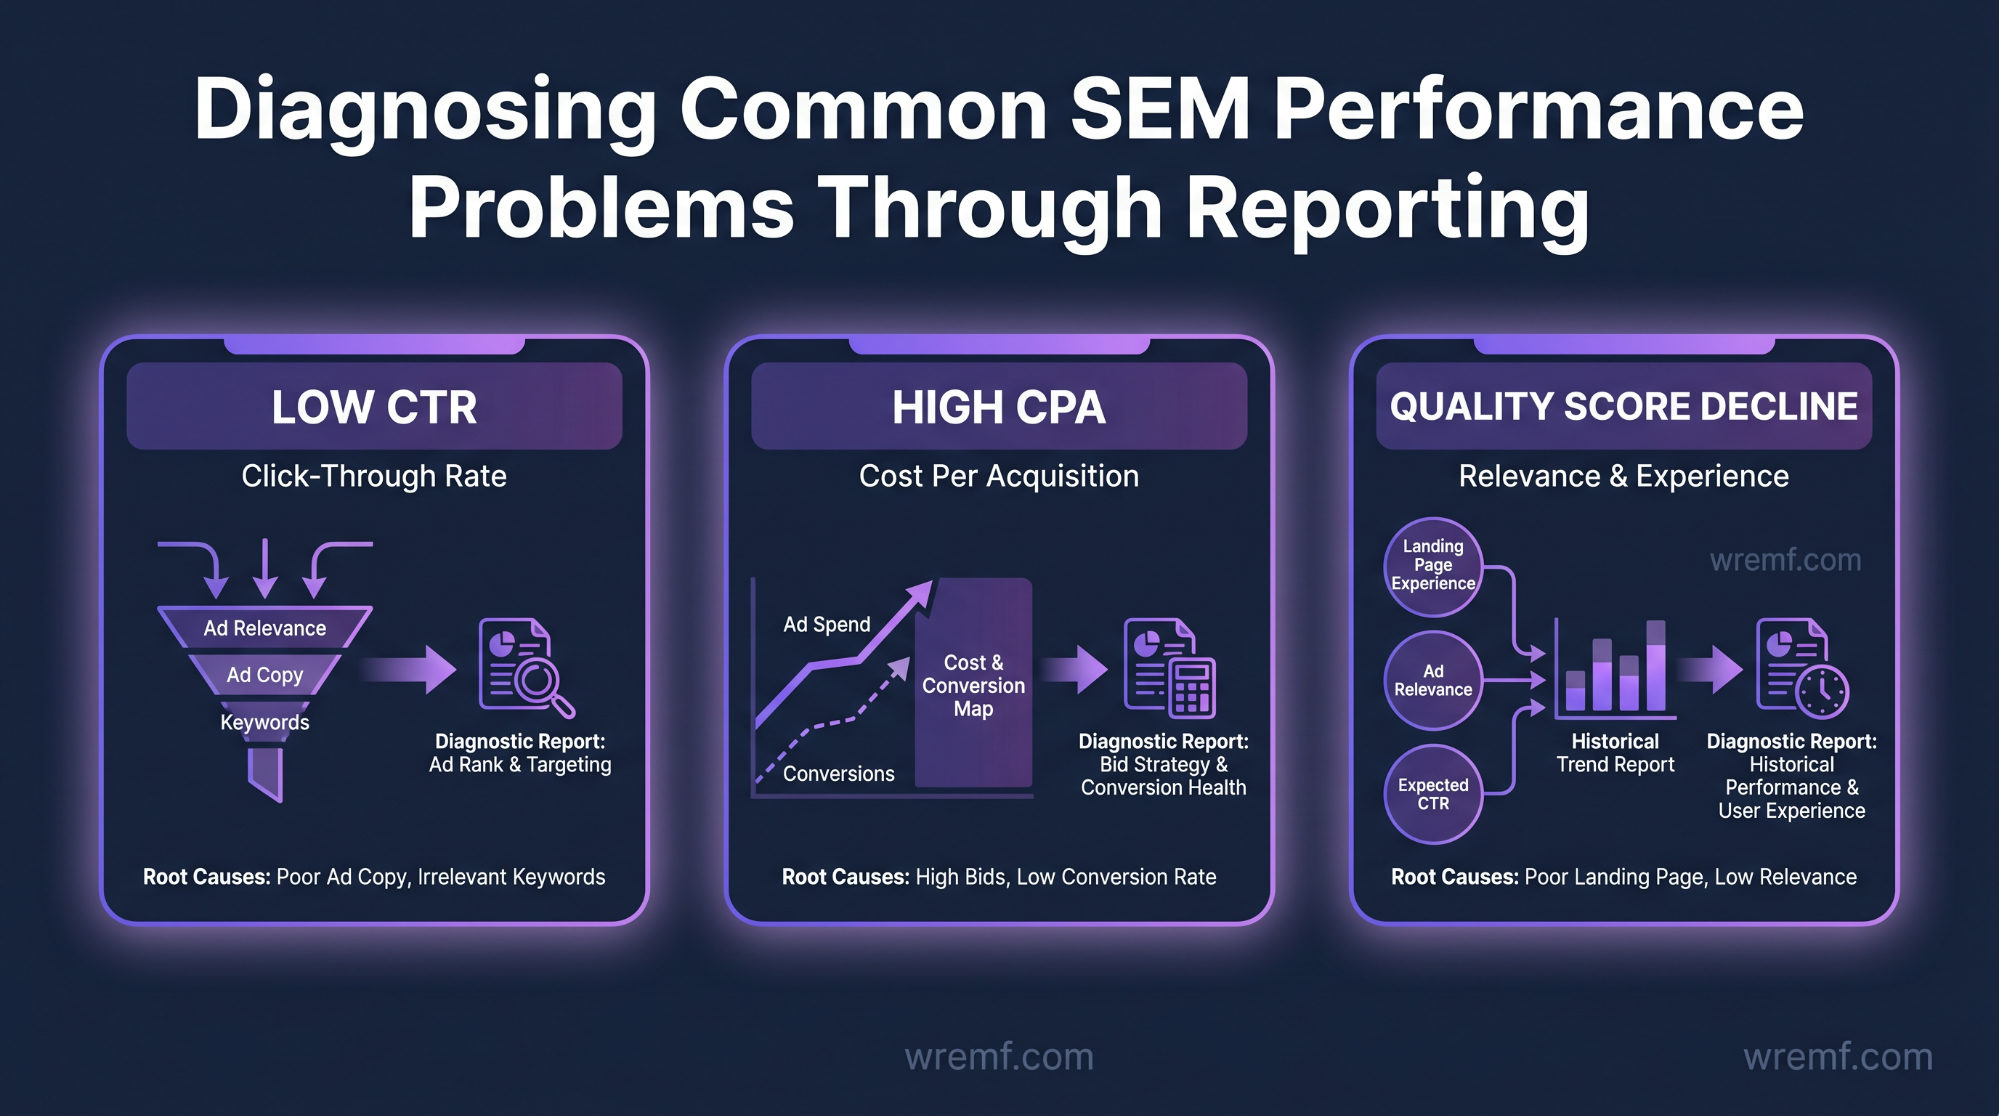
SEM reports are most valuable when they help teams identify what is wrong and why, not just what is happening. Systematic diagnosis using report data prevents teams from optimising the wrong variables.
High impressions with low Click-Through Rate usually indicate a keyword intent mismatch. The ad is appearing for searches where the ad copy or offer is not relevant enough to earn a click. The fix is either tighter keyword strategies, more specific ad copy, or negative keyword additions to eliminate irrelevant query traffic.
High Click-Through Rate with low conversion rate indicates a disconnect between the ad promise and the landing page experience. Buyers are clicking because the ad resonated, but the landing page is not delivering on the expectation created by the ad copy. Landing pages with high bounce rates and low conversion rates after paid clicks are high-priority optimisation targets.
Low quality score on core keywords drives up Cost Per Click and reduces ad position without requiring any change in competitor bidding. Quality score issues trace back to keyword relevance, ad copy alignment, and landing page experience. Improving quality score is one of the highest-leverage optimisation activities in paid search because it reduces cost while improving position simultaneously.
Rising Cost Per Acquisition with stable conversion rate suggests either increasing keyword competition driving up Cost Per Click, or audience behavior changes reducing traffic quality. Examining impression share data alongside competitor visibility signals helps distinguish between these two causes.
Attribution gaps appear when campaign performance looks flat in the ad platform but leads and revenue are increasing in the CRM. This often reflects assisted conversion patterns that last-click models miss. Reviewing the full conversion path in GA4 and importing offline conversion data from the CRM can reconcile the discrepancy.
Declining organic rankings alongside stable paid performance can indicate technical health issues on the website, content decay on organic landing pages, or increased competitive pressure in organic results. SEO reporting should run in parallel with SEM reporting so that shifts in the organic layer are caught before they affect the paid strategy.
As AI overviews and AI platforms increasingly intercept organic traffic before it reaches the website, teams should also diagnose whether drops in organic sessions correlate with rising AI visibility for competitors. The AI brand monitoring guide provides a framework for identifying these patterns.
KEY TAKEAWAY: Systematic diagnosis using SEM report data moves teams from observing performance trends to identifying root causes and taking specific corrective actions.
Realistic Use Cases: How Different Teams Use SEM Reports
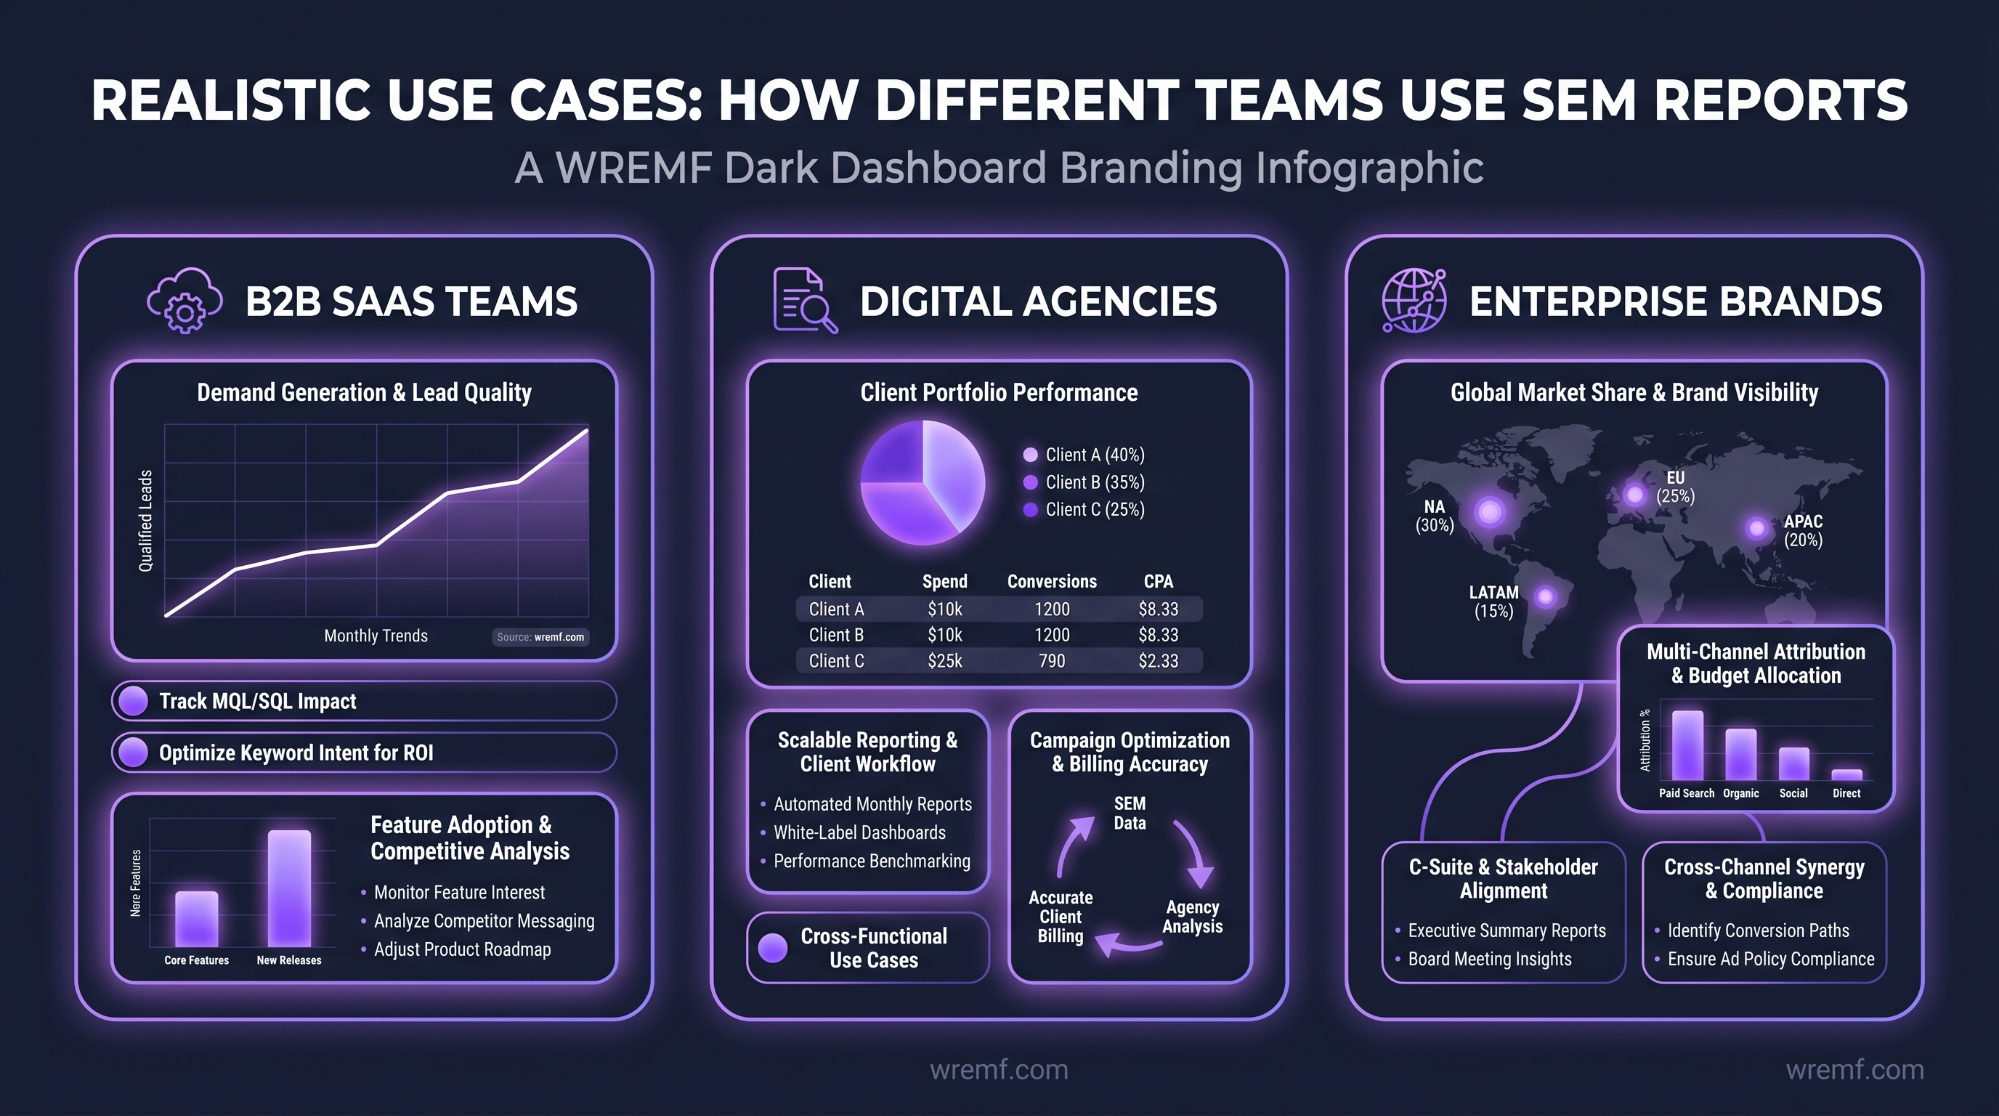
The way teams structure and use search engine marketing reports varies significantly based on their objectives, audience, and operational context. Three realistic scenarios illustrate the practical differences.
A B2B SaaS company with an in-house growth team uses weekly Google Ads reports to manage campaign performance and monthly SEM reports to review keyword rankings, organic traffic trends, and conversion rate changes across landing pages. The monthly report integrates data from Google Ads, GA4, and Google Search Console into a Looker Studio dashboard that the head of growth reviews with the marketing team and presents a summary to the CEO. After noticing that a competitor was being recommended more frequently in ChatGPT answers during a buyer research session, the team added AI visibility data from WREMF to their monthly review, tracking Share of Voice in AI Answers alongside their standard SEM metrics.
A digital agency managing paid search for eight B2B clients uses AgencyAnalytics to automate white-label report generation across all accounts. Each client receives a monthly SEM report covering Google Ads, Microsoft Advertising, and organic performance data with a branded dashboard and executive summary. The agency uses role-based access controls so clients can log in and view their own data without accessing other accounts. For one client in the software space, the agency added WREMF AI visibility tracking to the reporting package after the client asked why a competitor was appearing more frequently in Perplexity and Gemini answers for their target keywords.
An enterprise brand in a competitive vertical uses a dedicated SEM reporting framework that combines SearchAds 360 for paid campaign management, Power BI for cross-channel attribution, and quarterly executive reports that connect search investment to revenue, Customer Lifetime Value, and market share data. The enterprise team tracks impression share, branded searches, and content performance across a large keyword universe, and uses predictive analytics to forecast campaign budget requirements for the next quarter based on pipeline targets.
These scenarios show that SEM reporting is not a fixed template but a flexible practice that scales from a single Starter dashboard to a full enterprise reporting stack depending on team complexity and reporting objectives.
KEY TAKEAWAY: SEM reporting configurations range from automated agency dashboards to enterprise attribution stacks, and the right setup depends on team size, client volume, and the depth of business intelligence required.
Limitations and Honest Caveats in SEM Reporting
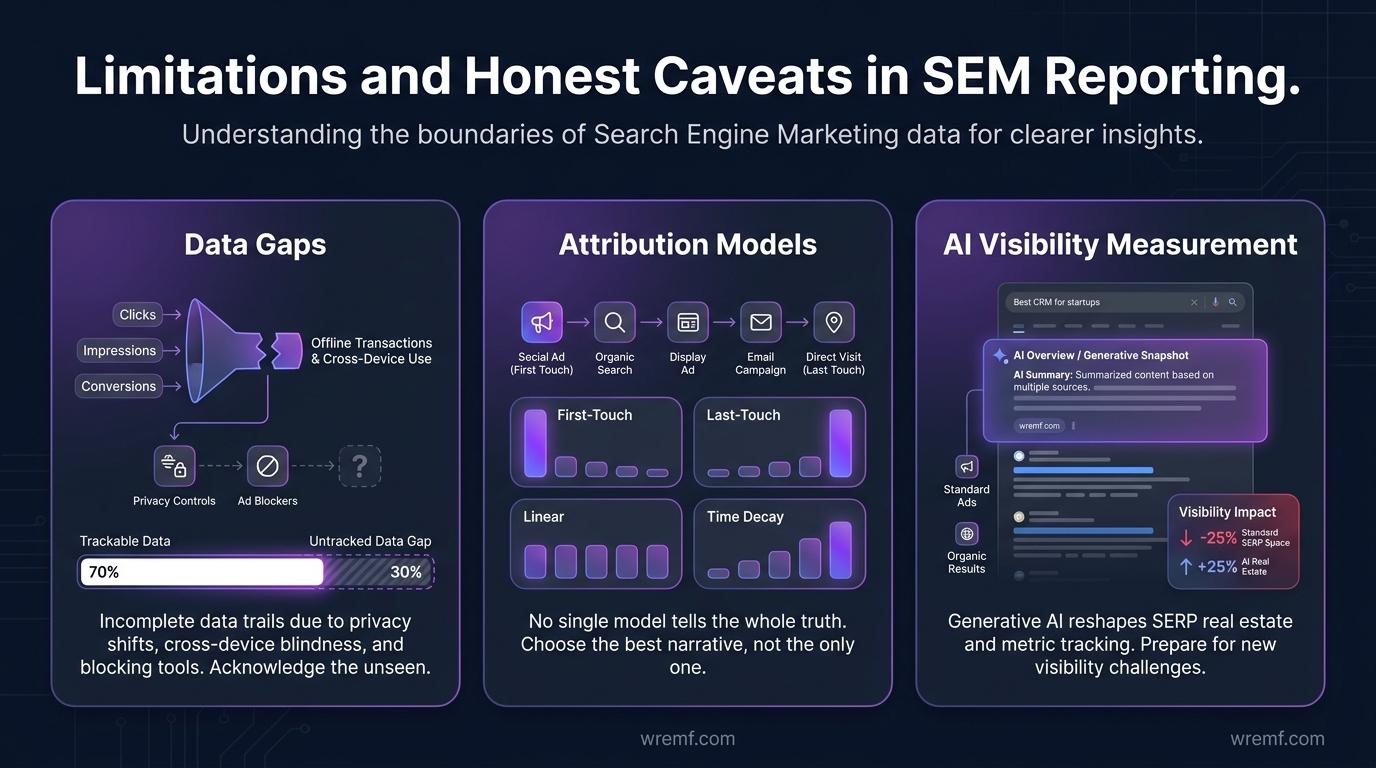
Search engine marketing reports are only as reliable as the data they are built on, and several structural limitations should be acknowledged clearly rather than glossed over.
Data gaps in conversion tracking are the most common reporting reliability issue. If conversion tracking is misconfigured in Google Ads or GA4, the entire report is built on incomplete data. Teams should audit their conversion tracking setup regularly and verify that key actions such as form submissions, phone calls, and demo requests are firing correctly. Importing offline conversion data from CRM systems requires custom implementation that many teams do not maintain consistently.
Attribution models do not capture reality perfectly. Data-driven attribution in GA4 is more accurate than last-click, but it still operates within the boundaries of measurable touchpoints. If a buyer reads a Podcast transcript, watches a YouTube Shorts video, and asks ChatGPT for vendor recommendations before searching on Google, none of those upstream influences may be reflected in the GA4 conversion path. Attribution gaps are inherent in multi-channel marketing, and reports should acknowledge this rather than present attribution data as definitive.
AI visibility measurement has its own limitations. AI engines do not return identical answers for every user or every prompt. Answers change based on the engine, the phrasing of the query, the time of day, the user's location, and the most recently indexed sources. No platform, including WREMF, can guarantee that a brand will appear in AI-generated answers, and AI visibility scores should be understood as probability estimates across a prompt set rather than fixed rankings. The generative AI optimization services guide explains this variability in detail.
Impression share and quality score data from Google Ads is directional rather than precise. These metrics are useful for diagnosing relative efficiency and competitive positioning, but they should not be treated as exact measurements.
Keyword research and keyword intent mapping become outdated as search behaviour evolves. A keyword strategy built six months ago may not reflect current audience behavior, new natural language patterns, or changes in how AI search surfaces answers. Regular refreshes of keyword intent data are necessary to keep SEM reports grounded in current reality.
Reporting cadence can create false urgency or false comfort. A weekly report showing a conversion rate drop may reflect normal statistical variance over a small sample rather than a genuine performance problem. Teams should apply statistical significance standards before acting on short-term fluctuations, particularly for campaigns with limited click volume.
KEY TAKEAWAY: SEM reports are valuable decision tools but carry inherent data limitations in attribution, AI visibility measurement, and keyword relevance that teams should acknowledge explicitly rather than treat report data as objective truth.
Common Misconceptions About Search Engine Marketing Reports
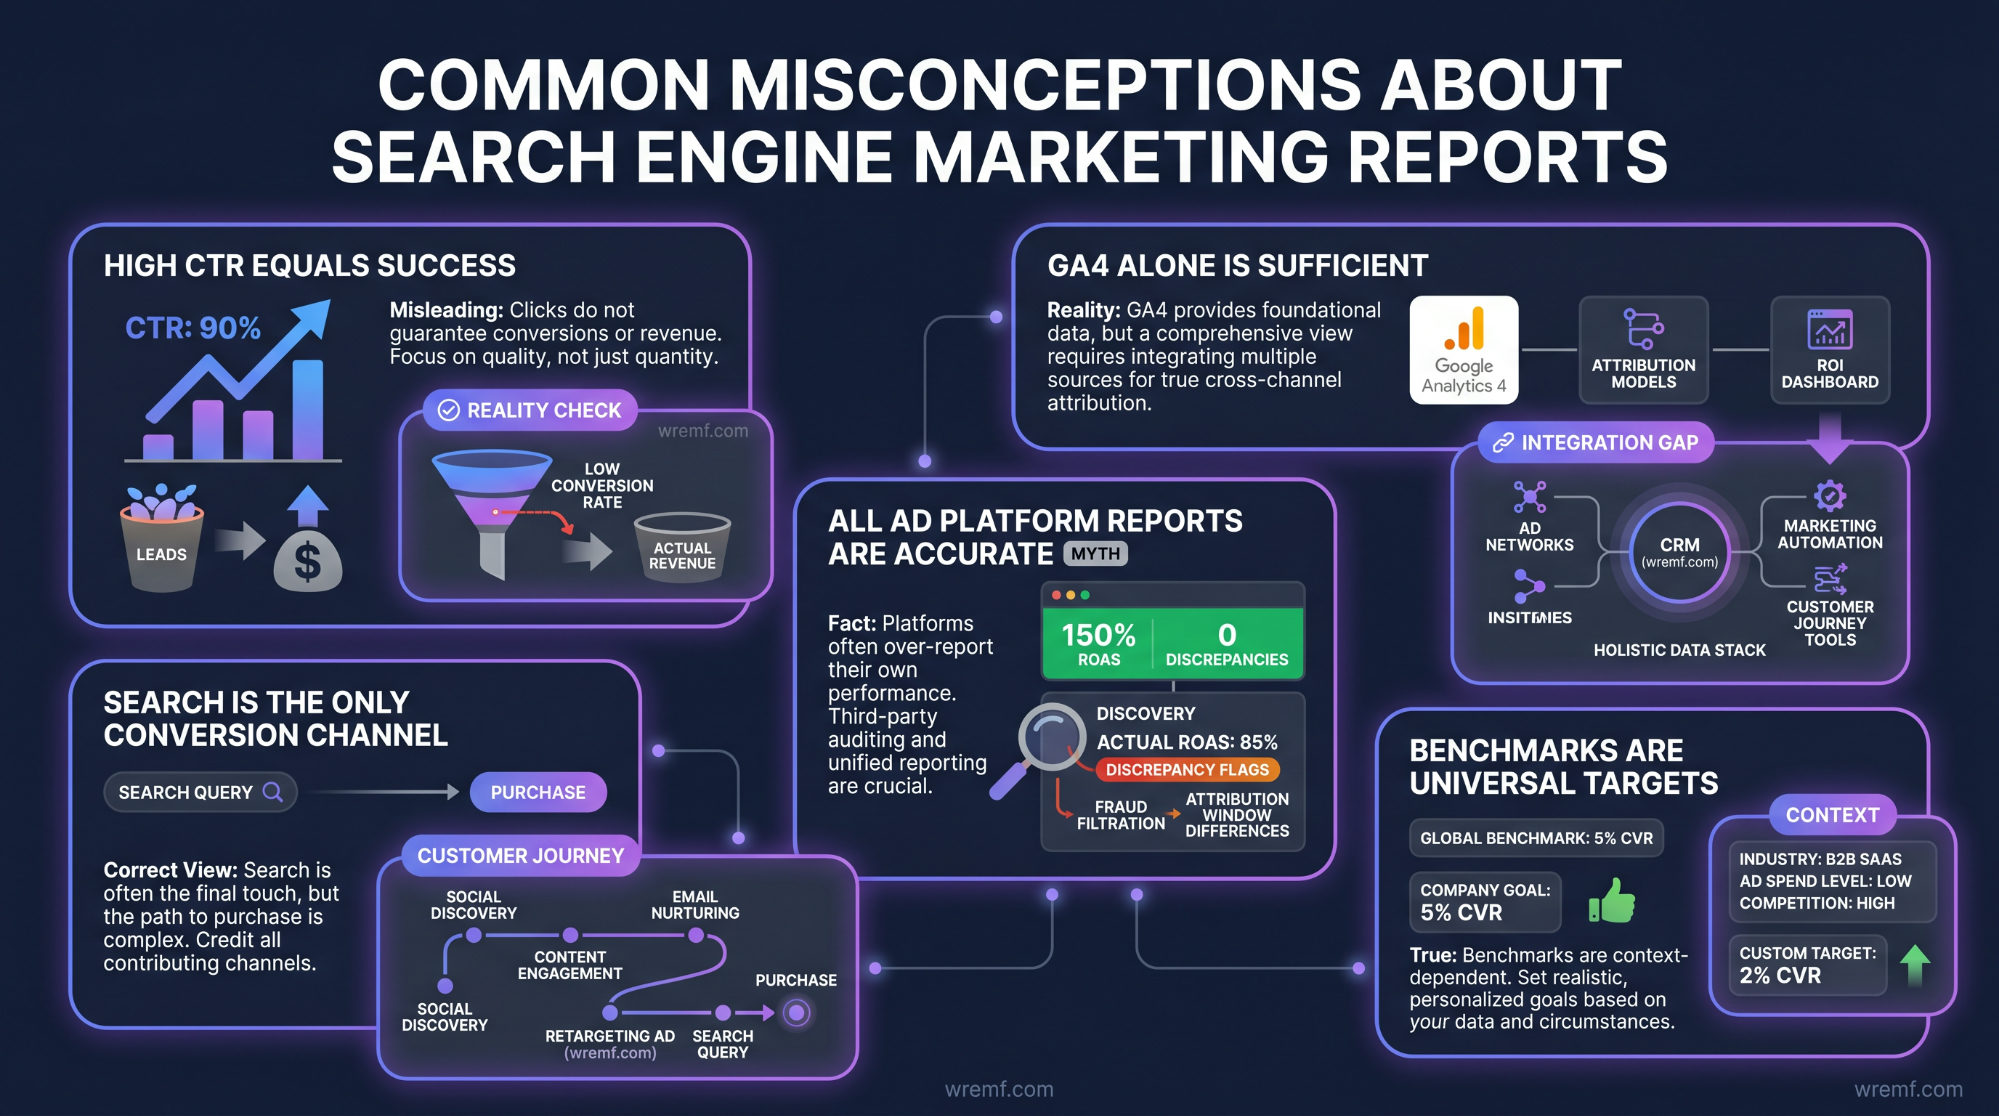
MYTH: If your brand ranks on page one in Google Search, you have strong search visibility.
FACT: Google rankings reflect organic position on the traditional search results page, but they do not account for AI overviews, AI-generated answers in ChatGPT or Perplexity, or Google's AI Mode responses. A brand can hold a first-page ranking and still be absent from the AI surfaces where a significant portion of buyers are now conducting vendor research. Search visibility in 2026 requires tracking both traditional rankings and AI visibility data.
MYTH: High Click-Through Rate means the campaign is performing well.
FACT: Click-Through Rate measures engagement with ad copy relative to impressions but says nothing about conversion quality or revenue impact. A campaign with a high CTR that sends traffic to a poorly optimised landing page will produce high click volume and low Return on Ad Spend. CTR is a directional input, not a success metric on its own, and always needs to be read alongside conversion rate and Cost Per Acquisition.
MYTH: AI visibility cannot be measured accurately enough to be included in SEM reports.
FACT: AI visibility can be measured systematically across multiple AI engines using prompt-level tracking, source citation analysis, and Share of Voice in AI Answers metrics. While AI engine responses are not fully deterministic, running structured prompt sets consistently across platforms like ChatGPT, Gemini, Claude, Perplexity, and others produces reliable trend data that is comparable across time periods and between competitors. WREMF provides this measurement capability across ten AI engines with scheduled monitoring and reporting.
MYTH: SEM reports should include as many metrics as possible to demonstrate thoroughness.
FACT: Comprehensive metric lists reduce report clarity and delay decisions. The most effective SEM reports include only the Key Performance Indicators that map directly to current campaign objectives and business goals. Adding metrics that stakeholders cannot act on creates noise that buries the signals that matter. Report quality is measured by decision speed and action clarity, not by the number of data points included.
MYTH: Google Analytics alone is sufficient for complete SEM attribution.
FACT: GA4 attribution models cover measurable digital touchpoints within Google's ecosystem but cannot track AI engine interactions, offline conversations, or touchpoints on platforms that do not share data with GA4. Teams that rely solely on Google Analytics for attribution will systematically undercount the contribution of upper-funnel channels, AI visibility, and offline conversion events to pipeline and revenue. A complete attribution framework requires GA4 connected to CRM data, plus AI visibility tracking from a dedicated platform.
KEY TAKEAWAY: The most damaging misconceptions in SEM reporting are the ones that feel like common sense, including that rankings equal visibility, high CTR equals success, and GA4 tells the complete attribution story.
Conclusion
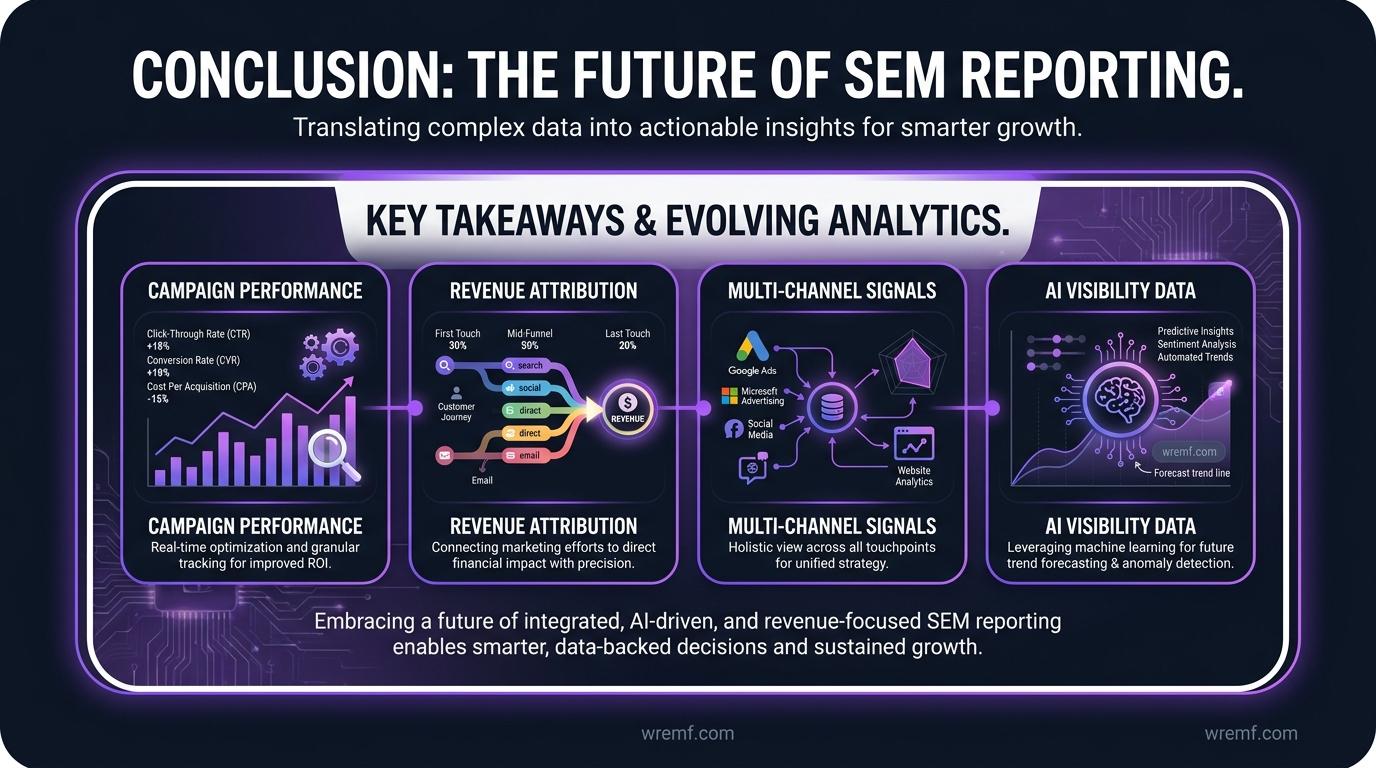
Search engine marketing reports are the operational foundation of paid and organic search strategy, and their scope is expanding. Teams that limit their reports to Google Ads click data and GA4 sessions are measuring an increasingly incomplete version of their search presence. Effective SEM reporting connects campaign performance to revenue attribution, segments data for different stakeholders, integrates multi-channel signals, and now includes AI visibility data to account for the buyers researching vendors in ChatGPT, Perplexity, Gemini, and Google AI Overviews. WREMF adds the AI visibility layer that traditional SEM reporting tools are not built to capture. Whether your team needs self-serve tracking through WREMF software or full managed execution, explore WREMF agency services to see how AI visibility measurement fits into your existing reporting framework.
Frequently Asked Questions About Search Engine Marketing Reports
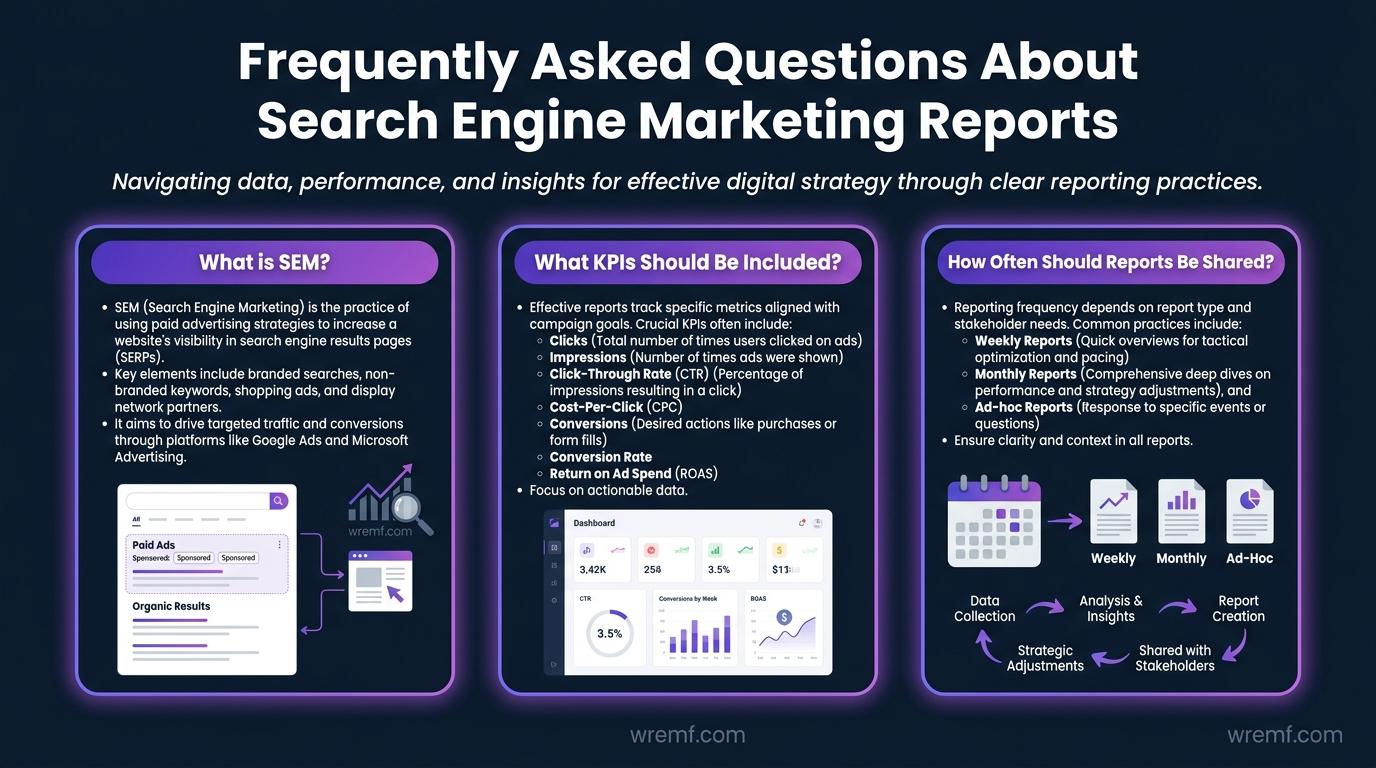
What is search engine marketing (SEM)?
Search engine marketing (SEM) is a form of digital advertising that places paid ads in search engine results pages (SERPs) to drive targeted traffic to a website. SEM primarily refers to pay-per-click (PPC) advertising on platforms such as Google Ads, Microsoft Advertising, and Bing Ads. Advertisers bid on keywords relevant to their target audience, and ads appear when users search those terms. SEM gives brands immediate visibility in search results, making it especially useful for lead generation, e-commerce campaigns, and time-sensitive promotions where organic rankings alone are insufficient.
What is the difference between SEM and SEO?
SEM refers to paid search advertising, where brands pay per click to appear in search results. SEO, or search engine optimization, refers to earning organic visibility through content quality, technical health, and authority signals. Both aim to improve visibility in search engines, but SEM delivers immediate placement through ad spend while SEO builds long-term visibility without direct per-click costs. Many marketing teams use both together because paid campaigns can fill visibility gaps while organic rankings are still growing. In reporting, SEO and SEM data are often kept separate but should be reviewed alongside each other to understand full search landscape performance.
What is SEM reporting?
SEM reporting is the process of measuring, analysing, and communicating the performance of paid search campaigns. A search engine marketing report typically covers metrics such as impressions, clicks, click-through rate (CTR), cost per click (CPC), conversion rate, cost per acquisition (CPA), return on ad spend (ROAS), and total ad spend. The goal of SEM reporting is not simply to share numbers but to explain what changed, why it changed, and what the team should do next. Good SEM reporting connects campaign performance directly to business objectives and helps stakeholders make informed decisions about budget, targeting, ad copy, and keyword strategies.
What KPIs and metrics should be included in a search engine marketing report?
The most important KPIs for a search engine marketing report depend on business objectives, but core metrics typically include total ad spend, impressions, clicks, CTR, CPC, conversion rate, CPA, ROAS, and quality score. For e-commerce teams, revenue attribution and customer lifetime value matter. For lead generation, qualified leads and lead scoring data are essential. Impression share shows how often your ads appear relative to eligible auctions. Ad position indicates where ads appear in search results. Every metric in the report should answer a business question, not simply fill space. If a metric does not connect to campaign performance or business outcomes, consider removing it.
Why does quality score matter in SEM reporting?
Quality score is Google's rating of the relevance and quality of your keywords, ad copy, and landing pages. A higher quality score typically results in lower cost-per-click and better ad position, meaning you pay less for more prominent placement. Including quality score in your SEM report helps marketing teams understand whether poor campaign performance is driven by budget constraints or by ad and landing page relevance issues. Improving quality score usually requires aligning keyword intent, ad copy messaging, and landing page content more precisely with what users are actually searching for.
How do you calculate return on ad spend (ROAS)?
Return on ad spend (ROAS) is calculated by dividing total revenue generated from ad campaigns by total ad spend. For example, if a campaign generated €10,000 in revenue from €2,000 in spend, the ROAS is 5x. There is no single benchmark for what counts as a good ROAS because it varies significantly by industry, profit margins, and business goals. A low-margin e-commerce business may need a ROAS of 8x or higher to be profitable, while a high-margin SaaS product may be satisfied with 3x. ROAS should always be interpreted in the context of CPA, conversion rate, and overall business objectives rather than as a standalone number.
What is cost per acquisition (CPA) and why does it matter?
Cost per acquisition (CPA) is the total amount spent on advertising divided by the number of new customers or conversions generated. It answers the critical business question: how much does it cost to acquire one customer? CPA is often more meaningful than CTR or impression share because it directly connects ad spend to actual business outcomes. A campaign with a high CTR but a poor conversion rate can still result in an unacceptably high CPA. Tracking CPA alongside ROAS and conversion rate helps marketing teams identify which campaigns are generating real business value and which are simply generating clicks without results.
What is click-through rate (CTR) and how does it affect campaign performance?
Click-through rate (CTR) is the percentage of users who click on an ad after seeing it, calculated by dividing total clicks by total impressions. A higher CTR generally signals that ad copy is relevant to the search query and the target audience. CTR can vary significantly based on ad position, keyword intent, geographical location, device type, and time of day. Reviewing CTR trends over time in your SEM report helps identify which ad copy variations resonate best and where relevance gaps exist. However, a high CTR does not automatically mean strong performance. CTR must be evaluated alongside conversion rate and CPA to determine whether clicks are translating into meaningful business results.
How often should SEM reports be shared?
Reporting frequency depends entirely on the audience and the purpose of the report. Campaign managers who are optimising day-to-day may need weekly performance data. Executives and senior stakeholders typically prefer monthly summaries that focus on business outcomes rather than tactical metrics. Agencies managing paid search for clients often deliver monthly reports with brief weekly or fortnightly check-ins during active campaign periods. The honest answer is that reporting should happen often enough to enable timely decisions without overwhelming stakeholders with data they cannot act on. Align reporting cadence with the decision-making needs of your specific audience.
What is the difference between an executive SEM report and a campaign manager report?
An executive SEM report, sometimes called a high-level or business impact dashboard, answers strategic questions quickly: how much was spent, what was returned, and are campaigns on track to meet goals? It focuses on ROAS, CPA, revenue attribution, and trends. A campaign manager report is a deeper operational view that explains why performance is changing. It includes keyword-level data, ad copy performance, quality score changes, impression share, bid adjustments, and landing page performance. Both are necessary but should be formatted differently. Presenting granular campaign data to executives wastes their time, while giving marketers only summary dashboards prevents effective optimisation.
How do I report on campaigns in AI Overviews and AI search surfaces?
Reporting on AI Overviews and AI-generated answers requires a different approach from traditional paid search reporting because there is no direct equivalent to CPC or impression data in most AI discovery surfaces. According to Google's AI Overviews documentation, AI Overviews are classified separately from standard organic sessions. To measure AI visibility, teams should track share of voice in AI answers by monitoring how often their brand is mentioned for key queries compared to competitors, track whether blog posts and landing pages are cited as sources within AI-generated responses, and analyse the sentiment of brand mentions in those answers. WREMF's source citation tracking and prompt intelligence tools are specifically built to monitor this layer of visibility across ChatGPT, Gemini, Claude, Perplexity, and Google AI Overviews, which standard SEM platforms do not cover.
Is SEO part of SEM reporting?
This depends on how your organisation defines SEM. Historically, SEM was used as an umbrella term covering both paid search and organic search optimisation. Today, most marketing teams and platforms use SEM to refer specifically to paid search advertising, while SEO reporting covers organic rankings, search intent, technical health, and content performance. In practice, the most useful reports blend both because organic and paid search often compete for the same keywords and serve the same target audience. Keeping SEO and paid search data in completely separate reports means missing the relationships between paid CTR, organic rankings, branded searches, and overall SERP visibility.
What does a strong SEM report executive summary include?
A strong executive summary in a search engine marketing report instantly answers three questions: what did we spend, what did we get for it, and are we on the right track? It should present total ad spend, revenue or leads generated, ROAS or CPA, and a brief explanation of what changed since the previous period and why. Supporting context such as budget pacing, major optimisation actions taken, and the recommended next steps should follow. Executives rarely need keyword-level data in a summary view. The goal is to demonstrate business impact quickly and clearly, not to showcase the volume of work performed.
How do I report on impressions without overstating their importance?
Impressions measure how many times an ad was shown in search results and are useful for tracking brand visibility and awareness campaign reach. However, impressions alone do not indicate business performance. A campaign generating one million impressions but no conversions has not produced measurable business value. In SEM reporting, impressions should be presented alongside CTR, clicks, and conversion rate to provide context. Impression share, which measures the proportion of eligible auctions where your ads actually appeared, is often a more actionable metric because it shows untapped visibility potential. Frame impressions as a reach indicator, not a success metric.
What are the three questions every SEM report should answer for each key metric?
For every significant metric change in a search engine marketing report, the report should answer: what changed, why it changed, and what the next move is. For example, if ROAS dropped 20 percent week-over-week, the report should identify what caused the drop, such as a top campaign hitting its budget cap or a competitor increasing bids on shared keywords, and then recommend a specific action, such as increasing the budget or pausing an underperforming ad group. This narrative structure transforms a SEM report from a data summary into a decision-making tool, which is what stakeholders actually need from campaign performance data.
How do I measure the ROI of SEM campaigns?
Measuring ROI from SEM campaigns requires connecting ad spend to actual revenue or business outcomes, not just platform conversions. Start by ensuring conversion tracking is correctly configured in Google Ads and Google Analytics 4. Then attribute revenue to specific campaigns, ad groups, and keywords by integrating GA4 data with your ad platforms. For lead generation businesses, tie ad-generated leads to CRM outcomes to determine how many marketing qualified leads actually converted into customers. Offline conversion data, when available, should also be imported into Google Ads to capture revenue from phone calls, in-person visits, or deals closed outside the digital environment. ROAS calculations are only reliable when the revenue data behind them is accurate and complete.
How do I choose the right SEM reporting tool?
Choosing a search engine marketing reporting tool depends on the size of your campaigns, the number of platforms you manage, your reporting audience, and the level of automation you need. Key features to evaluate include multi-platform data integration covering Google Ads, Microsoft Advertising, Facebook Ads, LinkedIn Ads, and other channels, automated report generation, customisable dashboards, white-label reporting for agencies, role-based access controls, and the ability to blend paid search data with Google Analytics 4 and Google Search Console data. Tools such as Looker Studio, AgencyAnalytics, DashThis, and Reportz.io each offer different combinations of these capabilities. The right choice depends on whether you need primarily a visualisation layer or a full data aggregation and attribution platform.
What are the benefits of automating SEM reporting?
Automating search engine marketing reporting reduces the time spent on manual data collection, minimises errors caused by copying and pasting data between platforms, and ensures stakeholders receive consistent, timely reports. Automation tools can pull data directly from Google Ads, Microsoft Advertising, Facebook Ads, and Google Analytics 4, then format and deliver reports on a set schedule. This frees marketing teams to spend more time on analysis and optimisation rather than report assembly. Automated reports also make it easier to maintain reporting cadence across multiple clients or campaigns simultaneously. For agencies managing many accounts, automation is not a convenience but a practical necessity for scalable operations.
What is impression share and why does it appear in SEM reports?
Impression share is the percentage of impressions your ads received out of the total number of impressions they were eligible to receive, based on your targeting settings and bid strategy. It appears in SEM reports because it reveals the gap between your current visibility and your potential visibility. A low impression share due to budget constraints indicates that spending more could increase reach without changing targeting. A low impression share due to ad rank issues suggests that improving quality score or raising bids would help. Tracking impression share over time helps marketing teams understand competitive pressure and identify opportunities to capture more search visibility without necessarily expanding keyword lists.
How do AI visibility data and AI share of voice fit into a modern SEM reporting framework?
Traditional SEM reporting covers paid and organic search performance within Google Ads, Microsoft Advertising, and similar platforms. However, as AI-powered discovery surfaces such as ChatGPT, Perplexity, Claude, Gemini, and Google AI Overviews increasingly influence how users find products and services before clicking any ad or organic result, the scope of search marketing intelligence is expanding. AI share of voice measures how often a brand appears in AI-generated answers compared to competitors across these surfaces. According to Gartner's AI research, traditional search usage patterns are shifting as AI answer engines become more common, which means SEM reports that ignore AI visibility data are increasingly incomplete. Teams building a full picture of search performance should consider supplementing paid and organic data with AI citation monitoring and prompt intelligence. WREMF tracks AI visibility across ten AI engines and connects those insights to content performance and competitive positioning.
When should a business use SEM software, an agency, or a hybrid model?
Software-only SEM and AI visibility platforms work well for teams with strong internal execution capabilities who need robust data and reporting but can manage strategy and optimisation themselves. Agency services suit teams that need strategic guidance, campaign execution, and ongoing optimisation without building all capabilities in-house. A hybrid model combines platform-level visibility tracking with agency-led execution and is typically the best fit for growth-stage B2B brands and marketing teams that want measurement, strategic support, and managed delivery in one arrangement. WREMF offers all three models, from self-service software for solo consultants and small SaaS teams through to fully managed AI visibility and AEO execution for enterprise brands and agencies running multi-market campaigns.
How does GA4 fit into SEM reporting?
Google Analytics 4 (GA4) connects ad platform data to on-site behaviour and conversion outcomes, making it an essential layer in any complete SEM reporting framework. By linking Google Ads to GA4, marketing teams can track not just clicks and impressions but what users do after landing on a website. GA4 also supports audience building for remarketing, custom event tracking for non-standard conversions, and natural language insights that can surface performance anomalies automatically. For example, GA4's insights feature can answer questions such as which landing pages lost visibility last month and surface supporting data without requiring manual analysis. When GA4 data is blended with ad platform data in a reporting tool, it becomes possible to answer which campaigns drive the most valuable customers rather than simply which campaigns generate the most clicks.
What is the difference between SEM, PPC, and paid search?
SEM (search engine marketing), PPC (pay-per-click), and paid search are terms that are often used interchangeably but carry slightly different meanings depending on context. Paid search refers specifically to text ads shown in search engine results pages. PPC refers to any advertising model where the advertiser pays per click, which includes search ads, display ads, and social media ads such as Facebook Ads and LinkedIn Ads. SEM has historically been used both as a broad term for all search marketing including SEO, and as a narrower term for paid search specifically. In most modern marketing contexts, SEM is used to mean paid search advertising, distinct from organic SEO. When building SEM reports, clarifying which definition your organisation is using avoids confusion about what data is included.
How much does SEM typically cost?
SEM costs vary widely depending on industry competitiveness, keyword bid prices, campaign scale, and the platforms used. Google Ads operates on an auction system where cost-per-click is determined by bid competition and quality score. Highly competitive industries such as insurance, legal services, and financial products can have CPCs of €10 to €50 or more per click, while less competitive niches may cost under €1 per click. Beyond media spend, teams also need to factor in management time or agency fees. There is no universal minimum spend, though most platforms recommend a minimum budget that allows statistically meaningful data to accumulate. SEM costs should always be evaluated relative to CPA and ROAS to determine whether spend levels are commercially justified.
Are Google Ads and SEM the same thing?
Google Ads is the most widely used platform for SEM, but SEM is not limited to Google Ads. Search engine marketing also includes Microsoft Advertising (formerly Bing Ads), which serves ads across Bing, Yahoo, and partner networks, as well as SearchAds 360 for enterprise cross-platform management, and in some definitions extends to paid placements on Amazon and other search-enabled platforms. Google Ads dominates SEM spend globally, which is why many marketers use the terms interchangeably, but a complete SEM strategy may involve multiple platforms depending on where the target audience searches. SEM reports should consolidate data from all active paid search platforms rather than treating Google Ads as the only relevant channel.
What should I look for when evaluating SEM reporting software?
When evaluating search engine marketing reporting tools, prioritise multi-channel data integration that pulls from Google Ads, Microsoft Advertising, Facebook Ads, LinkedIn Ads, and Google Analytics 4 into a single view. Look for automated report generation with scheduling options, customisable dashboards suited to different stakeholder views, white-label capabilities for client-facing reports, and role-based access controls to manage permissions across teams. Anomaly detection and predictive analytics features add value for teams managing large or complex campaigns. The ability to blend paid search data with SEO data, conversion tracking, and offline conversion data determines whether the tool supports full attribution or only surface-level platform reporting. Reviewing a sample report from any platform before committing is a practical way to assess whether the output actually meets your reporting needs.
How do branded searches fit into SEM reporting?
Branded searches, where users search for your company or product name directly, are an important segment to track separately within SEM reporting because they behave differently from non-branded queries. Branded CTR is typically higher, CPA is lower, and conversion rate is stronger because users already have some awareness of the brand. If branded search volume is growing without a corresponding paid branding campaign, it may indicate organic word-of-mouth, PR activity, or AI-driven recommendation visibility driving direct interest. Separating branded and non-branded performance in your SEM report reveals whether campaign growth is genuinely driven by paid acquisition or is being inflated by existing brand demand. This distinction matters significantly for budget allocation decisions.
How does AI-driven search change what SEM reports need to cover?
As research from organisations including McKinsey highlights the growing role of AI in how consumers discover and evaluate products, traditional SEM reports that only cover paid clicks and impressions are missing an increasingly important layer of search behaviour. AI-powered tools such as ChatGPT, Perplexity, Gemini, and Google AI Overviews are now influencing buying decisions before users ever reach a search results page or click a paid ad. SEM reports that ignore AI visibility data, AI citation frequency, and brand share of voice in AI answers are producing an incomplete picture of search marketing performance. Forward-looking marketing teams are beginning to supplement paid search reporting with AI visibility data to understand the full search landscape their audience is navigating. WREMF's AI visibility tracking monitors brand mentions, source citations, and competitive positioning across ten AI engines, providing the layer of intelligence that traditional SEM platforms do not currently offer.
Related reading
- The Complete Guide to Search Engine Marketing Consulting for B2B Brands
- Large Language Model Optimization Services: The Complete Guide to LLMO, AI Search Visibility, AEO, GEO, RAG, and LLM Performance
- Generative AI Optimization Services: The Complete Guide to GEO, AEO, LLM Optimization, and AI Visibility
- The Complete Guide to Choosing a Search Engine Marketing Agency for B2B Growth